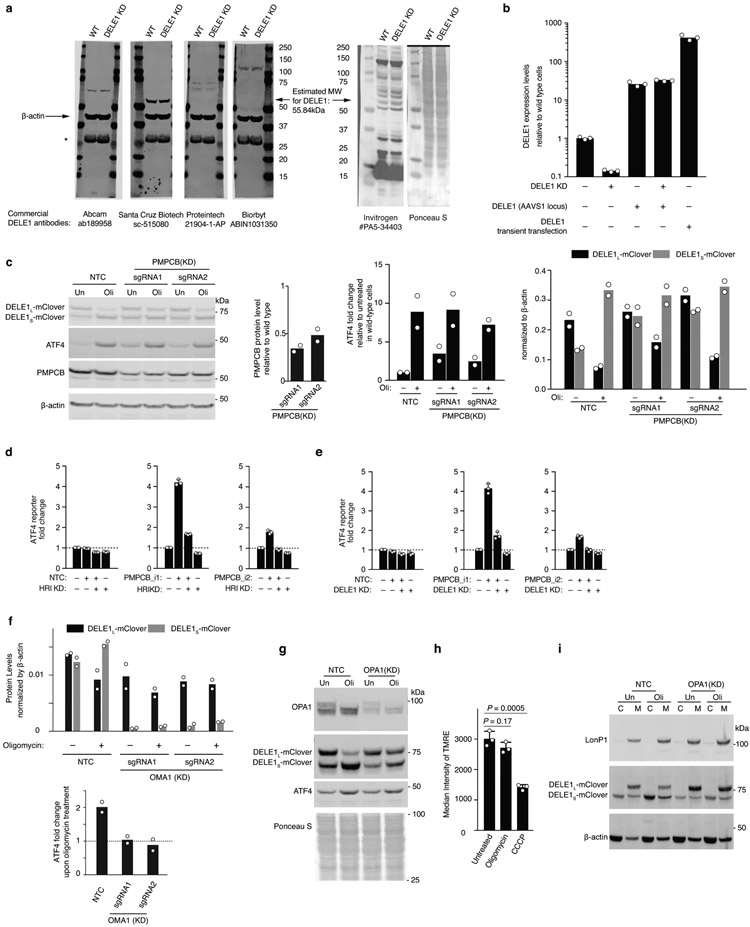
Extended Data Figure 2. Expression levels of DELE1 constructs and investigation of DELE1 cleavage and export mechanisms.
(a) Commercially available antibodies fail to detect DELE1. Lysates from HEK293T cells that were either WT or expressing a sgRNA knocking down DELE1 were probed with the indicated DELE1 antibodies and an antibody against β-actin. None of the bands detected by the DELE1 antibodies decreases in intensity in DELE1 knockdown cells. *Non-specific band. Similar results obtained in n > 2 independent experiments.
(b) Quantitative RT-PCR quantification of DELE1 mRNA levels in HEK293T cells knocking down (KD) DELE1 by CRISPRi and/or expressing DELE1-mClover stably from the AAVS1 safe-harbor locus or via transient transfection (n = 3 technical replicates).
(c-e) PMPCB knockdown induces the ATF4 translational reporter in the absence of mitochondrial stressors in an HRI-dependent and DELE1-dependent manner. (c) Left, representative immunoblot of ATF4, DELE1-mClover, PMPCB in two PMPCB knockdown cell lines and NTC control cells treated with 1.25 ng/ml oligomycin for 16 hrs where indicated. Right, quantification (mean ± s.d. n = 2 blots). (d,e) HEK293T reporter cells were co-transfected with PMPCB sgRNAs 1 or 2 (with a BFP marker) and HRI (d) or DELE1 (e) sgRNA (with a GFP maker) to generate a cell line with four populations as shown. The intensity of ATF4 reporter was quantified via flow cytometry (mean ± s.d., n = 3 culture wells).
(f) Quantification of immunoblot shown in Fig. 3f. n = 2 blots.
(g) Immunoblot of OPA1, DELE1-mClover, ATF4 in OPA1 knockdown and NTC control cells treated with 1.25ng/mL oligomycin for 16 hrs (Oli) or untreated (Un). Similar results obtained in n > 2 technical replicates.
(h) Measurement of mitochondrial potential by TMRE staining in cells treated with 1.25 ng/mL of oligomycin or 5 μM CCCP for 4 hrs (mean ± s.d., n = 3 culture wells, P values were determined using two-tailed unpaired t test).
(i) Subcellular localization of DELE1L and DELE1S in OPA1 knockdown and NTC control cells treated with 1.25ng/mL oligomycin for 16 hrs (Oli) or untreated (Un). Similar results obtained in n > 2 technical replicates.
For gel source data, see Supplementary Figure 1.

