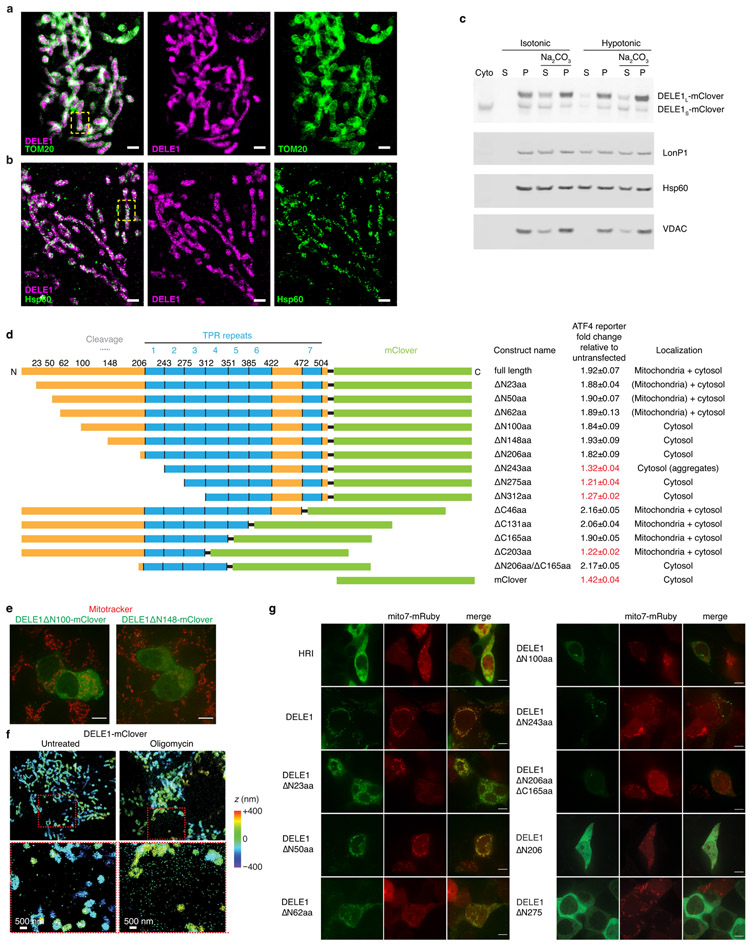
Extended Data Figure 3. Characterization of DELE1 submitochondrial localization.
(a-b) Zoom-out views for two-color 3D-STORM super-resolution images of DELE1-mClover vs. TOM20 and Hsp60. Two-color DELE1-mClover (magenta) vs. (a) TOM20 (green) or (b) Hsp60 (green), followed by the two separated color channels. Scale bars: 1 μm. The boxed regions correspond to Fig. 3g, h. Similar results were obtained in n = 3 independent experiments.
(c) Biochemical fractionation indicates that DELE1 associates with mitochondrial membranes.
Cells stably expressing DELE1-mClover were fractionated into cytosol and mitochondria. Mitochondria were incubated in either isotonic buffer (10 mM Tris HCl, pH 6.7, 0.15 mM MgCl2 0.25mM sucrose,1 mM DTT, protease inhibitor cocktail (Sigma #5892970001)) or H2O (extreme hypotonic condition) for 5 min, followed by centrifugation (10000 xg for 10 min) to separate the supernatant and pellet. The pellet was either dissolved with RIPA buffer or incubated with 0.1M NaCO3 (pH=11.4) for 30 min at 4°C. Supernatant and pellet from NaCO3-treated samples were collected for WB. Unlike soluble matrix protein LonP1 and HSPD1, which can be extracted with H2O incubation, only small proportion of DELE1 is present in the supernatant. NaCO3 can extract the majority of the DELE1S but not DELE1L, which is similar to the pattern of mitochondrial membrane protein VDAC, suggesting that DELE1L is more likely a membrane associated protein. n = 2 independent experiments.
For gel source data, see Supplementary Figure 1.
(d) The indicated DELE1-mClover constructs were transiently overexpressed in reporter cells, and reporter induction was quantified by flow cytometry (mean ± s.d., n = 3 culture wells). Subcellular localization was evaluated by microscopy in cells also expressing mitochondrial-targeted mRuby.
(e) Lack of co-localization of transiently expressed DELE1ΔN100-mClover and DELE1ΔN148-mClover (green) with the mitochondrial stain Mitotracker (red). Scale bar, 7 μm. Similar results obtained in n = 2 culture wells.
(f) Increased detection of DELE1-mClover outside the mitochondria upon oligomycin treatment. 3D-STORM super-resolution images of stably expressed DELE1-mClover (colors indicating depth in the z dimension) in untreated cells (left) and cells treated with 1.25 ng/mL oligomycin for 16 h (right). Areas boxed in red in the top panels are shown in higher magnification in the bottom panels. Similar results were obtained in n = 3 independent experiments.
(g) Co-localization of transiently expressed HRI-mClover and DELE1-mClover with the mitochondrial-targeted mRuby (Mito7-mRuby). Scale bar, 7 μm. n = 1 culture well.

