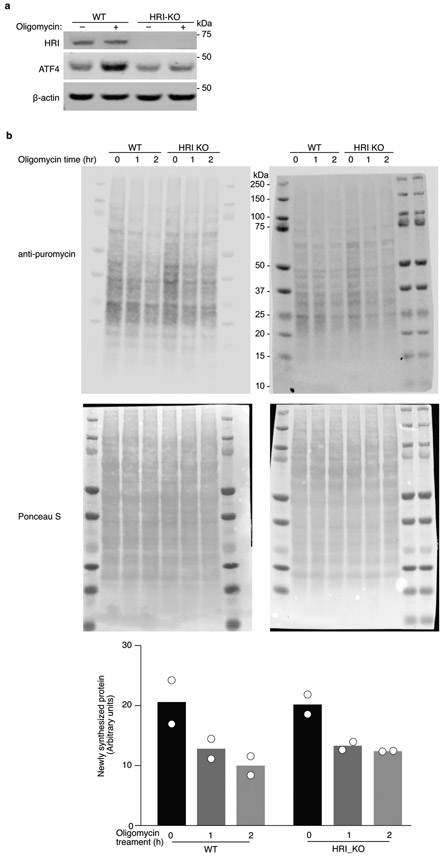
Extended Data Figure 5. Measurement of protein synthesis under mitochondrial stress.
(a) Immunoblot of HRI and ATF4 in wild type and HRI knockout (KO) cells. Cells were untreated or treated with 1.25 ng/mL oligomycin for 16 h. Similar results obtained in n = 2 independent experiments. For gel source data, see Supplementary Figure 1.
(b) Newly synthesized protein was labeled with puromycin. WT or HRI KO cells were treated with 1.25ng/mL puromycin for 1 or 2 hrs, or left untreated, followed by 10 min puromycin (10ug/mL) incubation. Protein from each sample was quantified by BCA assay (ThermoFisher #23225) and equally loaded. Two immunoblots from separate experiments probed with anti-puromycin (top) and Ponceau S staining (middle). Bottom, quantification of newly synthesized protein (ratio of anti-puromycin signal to Ponceau S signal) for these blots from n = 2 experiments.

