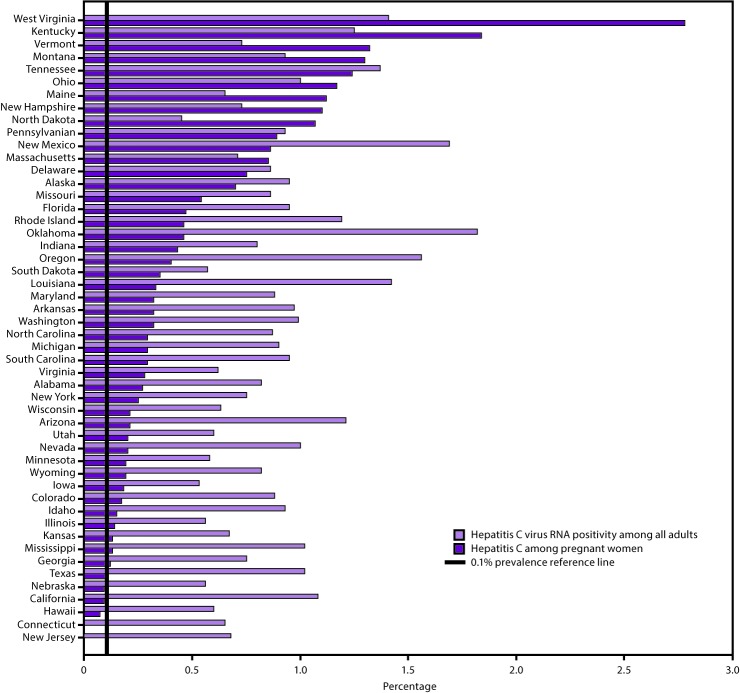
FIGURE 2.
Estimated prevalence of hepatitis C virus RNA positivity among all adults* and hepatitis C among pregnant women,† by state§
Abbreviations: HCV = hepatitis C virus; RNA = ribonucleic acid; NHANES = National Health and Nutrition Examination Survey.
* State estimates of HCV RNA positivity among all adults are based on a statistical model that allocated nationally representative hepatitis C prevalence from the 2013–2016 NHANES and additional previously published data for populations not sampled in NHANES to states according to the spatial demographics and distributions of 1999–2016 hepatitis C mortality and narcotic overdose deaths in the National Vital Statistics System.
† Data are from an analysis of 2015, National Center for Health Statistics birth certificate data (live births) (Schillie SF, Canary L, Koneru A, et al. Hepatitis C virus in women of childbearing age, pregnant women, and children. Am J Prev Med 2018;55:633–41).
§ Connecticut did not report maternal HCV infection on 2015 birth certificates and New Jersey reported infections from only a limited number of facilities; therefore, women residing in these two states were not included in the analysis.

