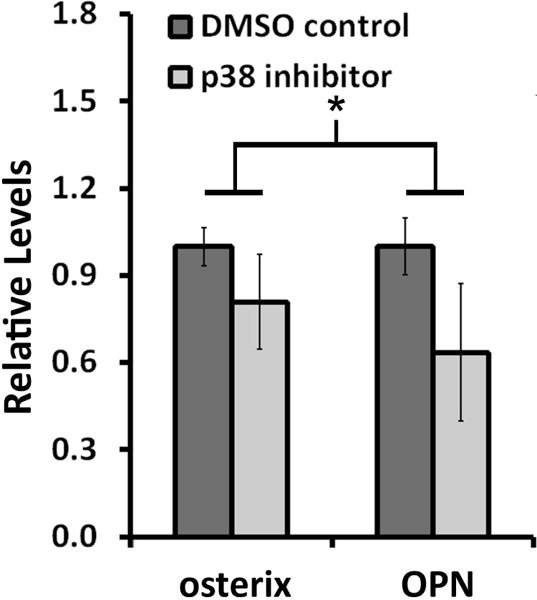
Figure 5.

hMSC expression of osterix and OPN in PEG-Scl2-2 hydrogels exposed to p38 inhibition (SB203580 in DMSO) relative to DMSO-only controls (n=3-4 per formulation). For the purpose of comparison, measures for each marker have been normalized to the DMSO control gels. * the connected bar indicates a significant difference in overall osteogenic marker expression between treatment groups, p < 0.05.
