Fig. 1.
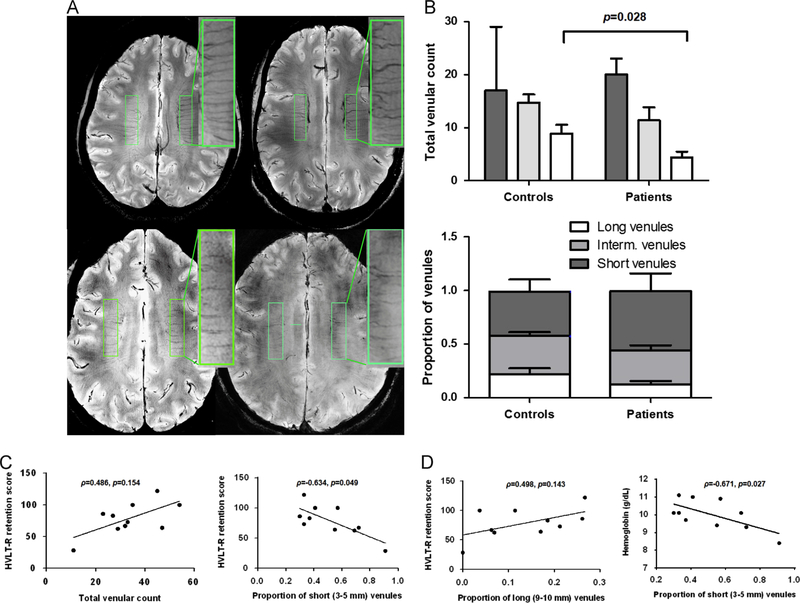
Abnormal venular pattern in SCA is associated with worse cognitive function and anaemia. (A) A rectangular region of interest (ROI, width 1 cm, length 4 cm) was defined between the frontal and occipital cornu on each cerebral hemisphere. Small parenchymal veins (venules) were identified as linear structures of intensity darker than the surrounding voxels, and length ≥3 mm. Venules were counted within the ROIs by consensus reading of two trained and blinded investigators with intraclass correlation coefficients of 0.817 (0.409, 0.952) for the rating of the long venules. Short venules were defined as being 3–5 mm in length, long venules were defined as being 9–10 mm in length and intermediate venules were defined as being between 6 and 8 mm in length. The proportion of short or long venules to the total number of venules was also computed for each participant. The two upper scans are from two representative control subjects and the two lower scans are from patient ID 11 (left) and ID 05 (right). As shown in the inlet with the magnified ROIs, patients had venular loss as compared to control subjects. (B) The density (upper graph) and proportion (lower graph) of long venules was decreased in SCA patients (p=0.028 and p=0.127, respectively). There was a parallel increase in the proportion of short venules in SCA patients (lower graph). The groups were compared by two-sided Mann–Whitney U (SPSS 20.0), and the results are shown as median (interquartile range). (C) The proportion of short venules was inversely correlated with the HLVT-R retention score (ρ=−0.634, p=0.024). Correlations with the total number of venules (ρ=0.486, p=0.154), and (D) the proportion of long venules (ρ=0.498, p=0.143) were similar albeit less strong. (D) The proportion of short venules was inversely correlated with the haemoglobin level (ρ=−0.671, p=0.027). Two-sided Spearman’s correlations were computed on SPSS 20.0.

