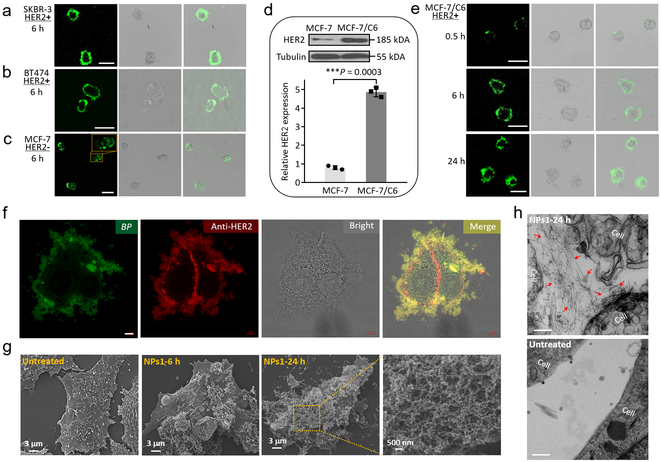
Fig. 2. The morphological characterizations of fibrillar-transformable NPs1 incubation with cultured HER2 positive cancer cells.
a-c, Cellular fluorescence distribution images of NPs1 interaction with (a) SKBR-3 cells (HER2+), (b) BT474 cells (HER2+) and (c) MCF-7 cells (HER2-) for 6 h. Scale bar in a-c is 50 μm. Experiments were repeated three times. d, Western blot and quantitative analysis of relative HER2 protein expression in MCF-7 cells and MCF-7/C6 cells. Data are presented as the mean ± s.d., n = 3 independent experiments. ***P < 0.001 (two-tailed Student’s t-test). Representative picture from three independent tests is shown. e, Cellular fluorescence distribution images of NPs1 interaction with MCF-7/C6 cells (HER2+) at the different time points (0.5, 6 and 24 h). Scale bar in e is 50 μm. Experiments were repeated three times. f, Fluorescence binding distribution images of the nanofibrillar network of NFs1 and HER2 antibody (29D8 rabbit Ab and HER2 peptide of NPs1 recognize different epitopes of HER2 receptor) on the cell membrane of MCF-7/C6 cells. HER2 antibody was used to label HER2 receptors. Scale bar in f is 5 μm. Experiments were repeated three times. g, SEM images of untreated MCF-7/C6 cells and cells treated by NPs1 for 6 h and 24 h. Experiments were repeated three times. h, TEM images of untreated MCF-7/C6 cells and cells treated by NPs1 for 24 h. The red arrow shows fibrillar network. Scale bar in h is 200 nm. Experiments were repeated three times. The concentration of NPs1 was 50 μM.

