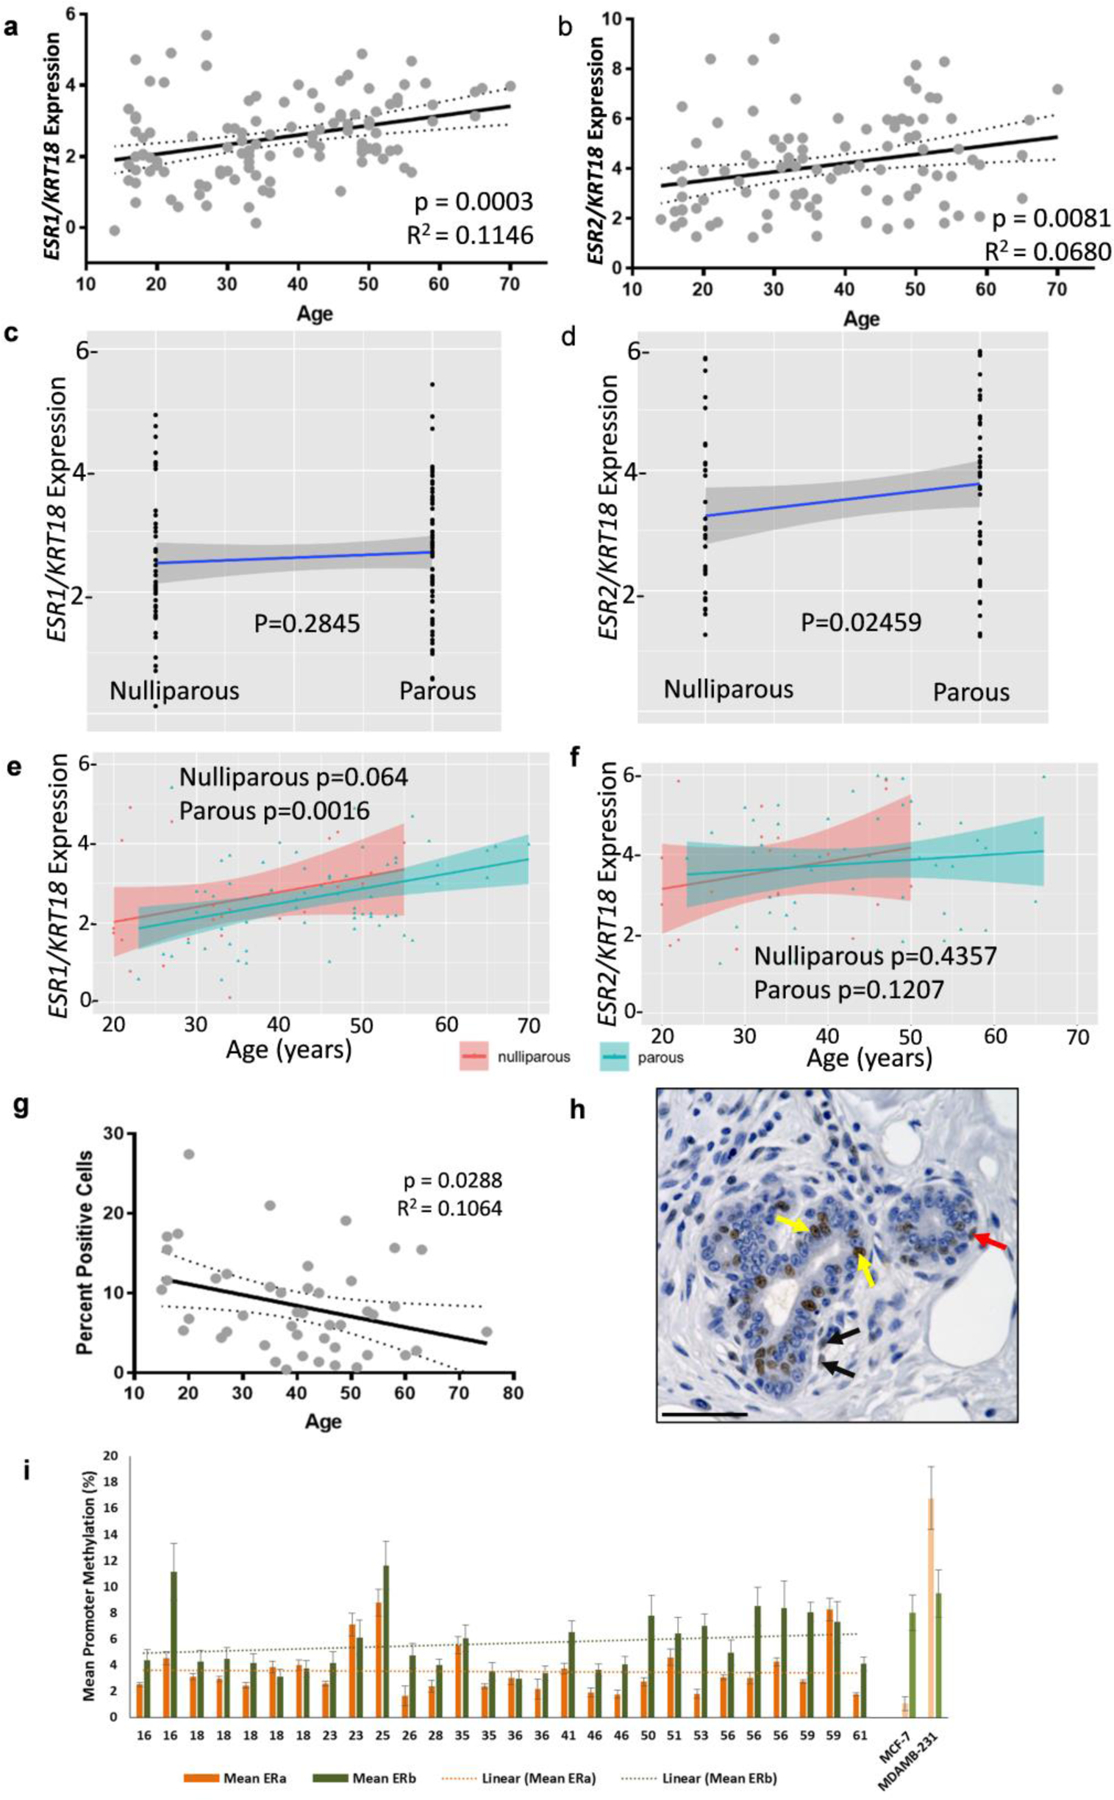
Fig. 1: Estrogen receptor expression diversity among women.

(a-b) Agilent microarray data showing relative (a) ESR1 mRNA levels from 111 donor samples and (b) ESR2 mRNA levels from 102 samples, normalized to KRT18 expression. Linear regression analysis showed a significant increase in both ESR1 (P < 0.001) and ESR2 mRNA levels (P < 0.01) with age. Dotted lines indicate 95% confidence intervals and solid line indicates the best fit line. R2 values for best fit lines are indicated. (c-d) Relative ESR1 and ESR2 expression in nulliparous and parous women. (c) There is no difference in relative normalized ESR1 expression between nulliparous and parous donors. (d) ESR2 expression is increased by parity. (e) Normalized ESR1 expression increases with age in parous donors and is approaching significance in nulliparous donors. (f) Normalized ESR2 expression does not increase with age for either nulliparous or parous donors. (g-h) IHC using ERβ antibody (PPG5/10) was performed on paraffin-embedded sections from 45 patient samples. (g) Quantification of ERβ positive ductal cells. Linear regression analysis of ERβ protein levels shows a significant decrease in ERβ with age (P < 0.05). 95% confidence intervals indicated by dotted lines and solid line indicates the best fit line. (h) Representative image of IHC. Arrows indicate representative positive cells: yellow arrows indicate positive luminal cells, red indicate positive basal cells, and black indicate positive stromal cells. Scale bar 50μM. (i) Methylation in the promoters for ESR1 and ESR2 show there is no association with promoter methylation and age for either ESR1 or ESR2.
