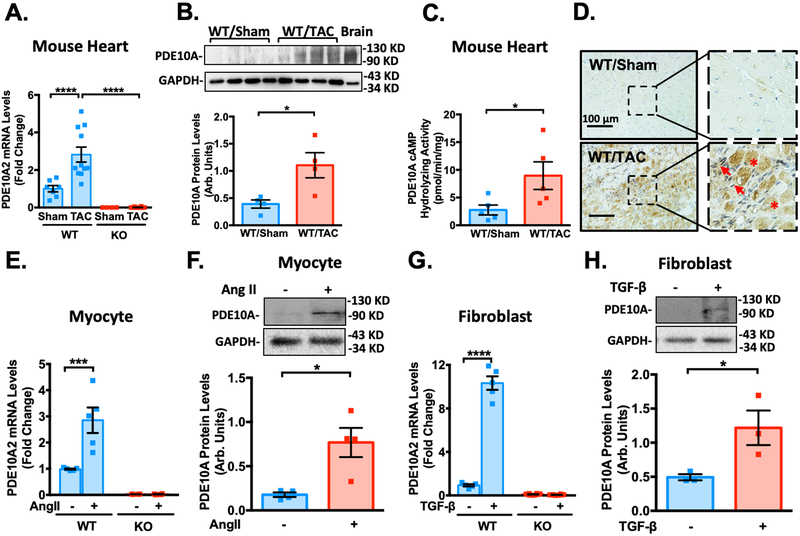
Figure 1: PDE10A expression is upregulated in mouse failing hearts as well as in isolated cardiac myocytes (CMs) and cardiac fibroblasts (CFs).
(A) PDE10A2 mRNA levels assessed by qPCR in mouse heart tissues from mice with 8 weeks of TAC or sham operation, normalized to GAPDH. n=7 for PDE10A-WT/Sham; n=11 for PDE10A-WT/TAC; n=4 for PDE10A-KO/Sham; and n=12 for PDE10A-KO/TAC. (B) PDE10A protein levels measured by western blotting in mouse tissues from mice with 8 weeks of TAC or sham operation, bar graph shows the average of n=4 WT/Sham; n=4 WT/TAC. (C) PDE10A cAMP-hydrolyzing activity in mouse heart tissues from mice with 8 weeks of TAC or sham operation; n=5 for WT/Sham; and n=5 for WT/TAC. (D) Immunohistochemistry staining of PDE10A in myocardium of WT mouse hearts with sham or TAC operation for 8 weeks. Arrows indicate activated CFs. Asterisks indicate CMs. Scale bars: 100 μm. Similar results were obtained from 3 pairs of tissue samples. (E) PDE10A2 mRNA levels assessed by qPCR in mouse adult CMs isolated from PDE10A-WT and -KO mice and stimulated with Ang II (100nM) or vehicle for 72 h, normalized to GAPDH; n=5 replicates from 4 PDE10A-WT mice and n=4 replicates from 4 PDE10A-KO mice. (F) PDE10A protein levels measured by western blotting in CMs isolated from PDE10A-WT mice and stimulated with Ang II (100nM) for 72 h; bar graph shows the average of n=4 replicates from 3 hearts. (G) PDE10A2 mRNA levels assessed by qPCR in CFs isolated from PDE10A-WT and -KO mice and stimulated with TGF-β (10ng/ml) or vehicle for 24 h, normalized to GAPDH; n=5 replicates from 4 PDE10A-WT mice and n=8 replicates from 5 PDE10A-KO mice. (H) PDE10A protein levels measured by western blot in CFs isolated from PDE10A-WT mice and stimulated with TGF-β (10ng/ml) for 24 h; bar graph shows the average of n=3 replicates from 3 hearts. All data represents the mean ± SEM. Statistics in A, E and G were performed using a two-way ANOVA and Holm-Sidak post-hoc test. Statistics in B-C, F and H were performed using a student t-test. *P < 0.05, ***P < 0.001, ****P < 0.0001.

