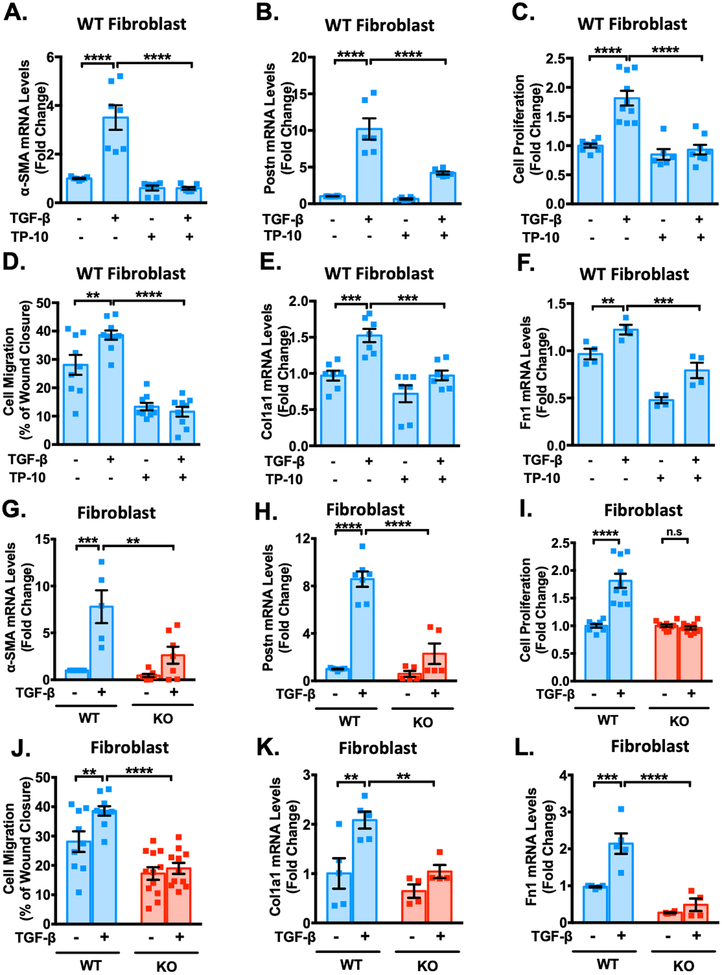
Figure 4: PDE10A inhibition and deficiency attenuate TGF-β-stimulated cardiac fibroblast activation, proliferation, migration and ECM synthesis and in vitro.
Cardiac fibroblasts (CFs) isolated from PDE10A-WT or PDE10A-KO mice as indicated, serum starved for 24 h, and pretreated with TP-10 (5 μM) or vehicle, followed by TGF-β (10ng/ml) or vehicle treatment for 24 h or 48 h. mRNA levels of α-SMA (A) and Postn (B) were assessed via qPCR, normalized to GAPDH; n = 4–7 replicates from 3 mice. (C) PDE10A-WT CFs were pretreated with TP-10 (5 μM) or vehicle for 30 min prior to TGF-β (10 ng/ml) for 48 h. Cell proliferation was measured by CCK8 assay; n = 6–10 replicates from 3 mice. (D) After the monolayer formation, PDE10A-WT CFs were serum starved for 24 h and scratches were made in the monolayer. CFs were pretreated with TP-10 (5 μM) or vehicle for 30 min prior to TGF-β (10 ng/ml) for 18 h, and imaged for comparison of wound closure, n = 9–10 replicates from 4 mice. mRNA levels of Col1a1 (E) and Fn1 (F) were assessed via qPCR, normalized to GAPDH; n = 4–7 replicates from 3 mice. mRNA levels of α-SMA (G), Postn (H) were assessed via qPCR, normalized to GAPDH; n = 5–7 replicates from 3–5 mice. (I) PDE10A-WT or -KO CFs were stimulated with TGF-β (10 ng/ml) for 48 h. Cell proliferation was measured by CCK8 assay; n = 8–10 replicates from 3 mice. (J) After the monolayer formation, PDE10A-WT or -KO CFs were serum starved for 24 h and scratches were made in the monolayer. CFs were stimulated with TGF-β (10 ng/ml) for 18 h, and imaged for comparison of wound closure, n = 9–12 replicates from 4 mice. mRNA levels of Col1a1 (K) and Fn1 (L) were assessed via qPCR, normalized to GAPDH; n = 4–5 replicates from 3–5 mice. All data represents the mean ± SEM. Statistics were performed using a two-way ANOVA and Holm-Sidak post-hoc test. **P < 0.01, ***P < 0.001, ****P < 0.0001. n.s.: no significant difference.

