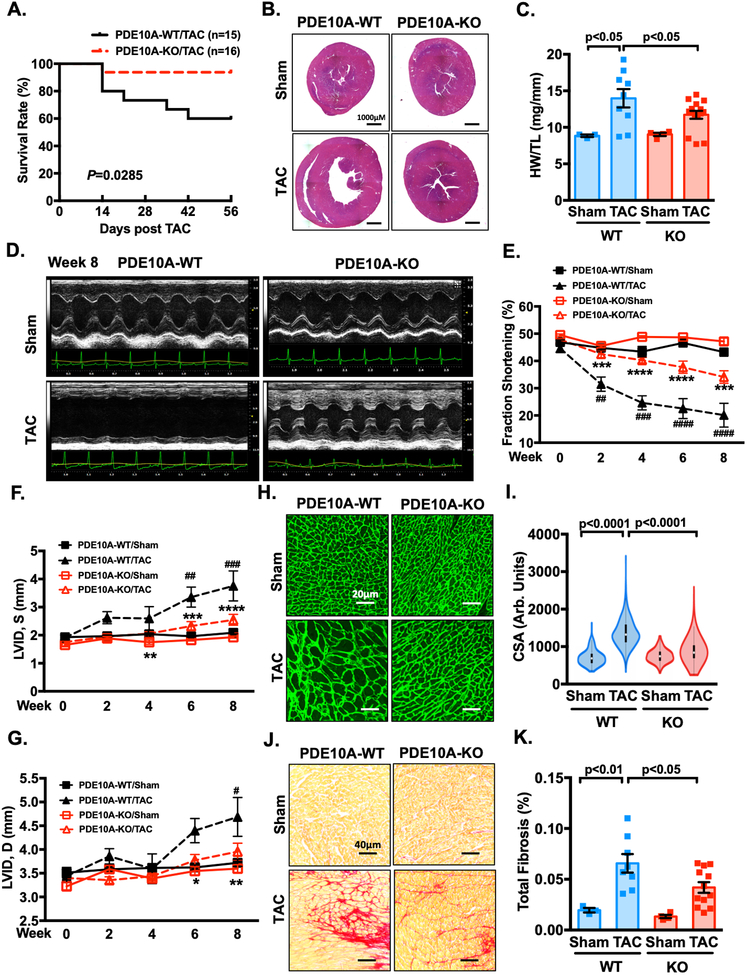
Figure 5: PDE10A deficiency attenuates TAC-induced cardiac remodeling and dysfunction.
Male PDE10A-WT and PDE10A-KO mice at 8–12 week of age were subjected to TAC or sham operation for 8 weeks. (A) The survival curve of PDE10A-WT and PDE10A-KO mice after TAC surgery. P < 0.05, Log-Rank (Mantel-Cox) test. (B) Representative images of hematoxylin and eosin staining in mouse hearts after TAC or sham operation. Scale bars: 1000 μm. (C) Quantification of heart weight/tibia length. (D-G) Cardiac function was monitored via echocardiography at baseline and at 2, 4, 6 and 8 week points after the surgery: (D) representative M-mode echocardiographic images of each study group at 8 week point; (E) progressive percent fraction shortening, (F) left ventricular diameter at systole (LVID,s); and (G) left ventricular diameter at diastole (LVID,d). (H) Representative images of wheat germ agglutinin (WGA)-fluorescein isothiocyanate-staining in mouse hearts after TAC or sham, showing cardiac myocyte (CM) cross-sectional area (CSA). Scale bars: 20 μm. (I) Quantitative data of CM hypertrophy assessed by CSA; n = 3–12 hearts per group with 300–600 CMs analyzed per heart. (J) Representative images of heart sections stained with picrosirius red. Red staining shows fibrotic areas. Scale bars: 40 μm. (K) Quantification of total fibrosis. All data represents the mean ± SEM. Statistics in C, I and K were performed using a two-way ANOVA and Holm-Sidak post-hoc test. Statistics in E-G were performed using a repeated measures ANOVA and Holm-Sidak post-hoc test. *P < 0.05, **P < 0.01, ***P < 0.001, ****P < 0.0001 PDE10A-KO/TAC vs. PDE10A-WT/TAC; # P < 0.05, ## P < 0.01, ### P < 0.001, #### P < 0.0001 PDE10A-WT/TAC vs. PDE10A-WT/sham. Animal numbers: PDE10A-WT/sham: n = 3 in C, E-G, I and K; PDE10A-WT/TAC: n = 15 in A, n = 9 in C, n = 8 in E-G and K, n = 6 in I; PDE10A-KO/sham: n = 4 in C, E-G, I and K; PDE10A-KO/TAC: n = 16 in A, n = 15 in C, n =12 in E-G, I and K.

