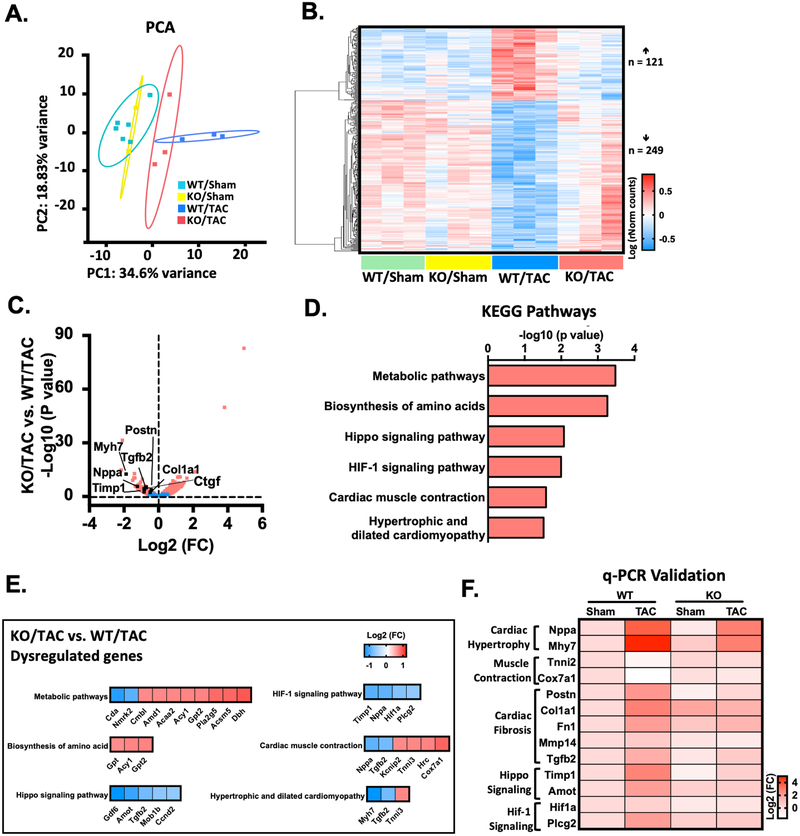
Figure 6: RNA-Seq identifies transcriptome that are dysregulated by PDE10A during heart failure pathogenesis.
(A) Principle component analysis (PCA) reveals the variance in transcriptome distribution in PDE10A-WT and PDE10A-KO hearts at sham and 8 weeks after TAC. Each point represents the projections of individual hearts onto principle component (PC). The majority of genetic variation is addressed by the first (PC1, 34.6%), followed by the second (PC2, 18.83%). (B) Heatmap of genes differentially expressed in PDE10A-WT or PDE10A-KO hearts at 8 weeks after TAC or sham. Each column represents an individual replicate and there are 3 replicates per group. Each row represents an individual gene. The top of heatmap is the cluster of genes that are upregulated in PDE10A-WT/TAC, while the bottom is the cluster of genes downregulated in PDE10A-WT/TAC compared to PDE10A-WT/sham or PDE10A-KO/sham and reversed in PDE10A-KO/TAC. The color bar represents relative expression of log-transformed, normalized counts with upregulated genes shown in red and downregulated genes in blue. (C) Volcano plot shows magnitude and significance of genes that altered in PDE10A-KO hearts versus PDE10A-WT hearts after TAC. Genes that significantly downregulated (left) and upregulated (right) in PDE10A-KO/TAC versus PDE10A-WT/TAC are plotted in red. Representative known genes involved in pathologic remodeling, such as Myh7, Nppa, Tgfb2, Ctgf, Timp1, Postn and Col1a1, are picked out (black dots) for each volcano plot. (D) Kyoto Encyclopedia of Genes and Genomes (KEGG) pathway analysis of differentially expressed genes in PDE10A-WT and PDE10A-KO after TAC. Signaling pathways are organized in the order of significance as -log10 of P value. P value was corrected by Benjamini & Hochberg multiple test, which < 0.05 was considered significant. (E) Gene list in each KEGG signaling pathway. The color bar represents relative expression of log2-transformed. (F) qPCR validation of cardiac hypertrophic genes Nppa and Myh7, muscle contraction genes Tnni2 and Cox7a1, cardiac fibrotic genes Postn, Col1a1, Fn1, Mmp14 and Tgfb2, hippo signaling related genes Timp1 and Amot, and HIF-1 signaling related genes Hif1a and Plcg2 identified by RNA-seq in the hearts of PDE10A-WT or PDE10A-KO mice after sham or TAC surgery, normalized to GAPDH; n = 3 hearts per group. The color bar represents relative expression of log-transformed.

