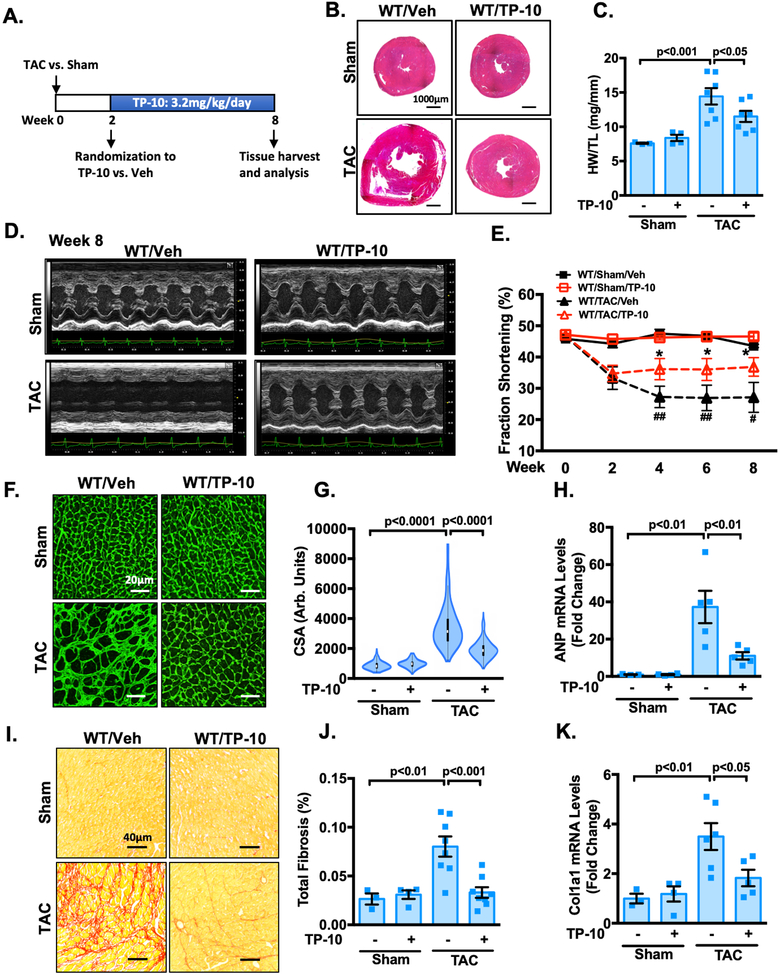
Figure 8: TP-10 intervenes the progression of pre-stimulated cardiac remodeling and dysfunction.
Male WT mice at 8–12 week of age were subjected to TAC or sham operation for 8 weeks. Mice were then randomized to receive either TP-10 (3.2mg/kg/day) or vehicle treatment 2 weeks after sham or TAC and the drug treatment was continued for 6 weeks. (A) Experiment timeline. (B) Representative images of hematoxylin and eosin staining in mouse hearts after TAC or sham operation with vehicle or TP-10 treatment as indicated. Scale bars: 1000 μm. (C) Quantification of heart weight/tibia length. (D-E) Cardiac function was monitored via echocardiography at baseline and at 2, 4, 6 and 8 week points after the surgery. (D) representative M-mode echocardiographic images of each study group. (E) progressive percent fraction shortening. (F) Representative images of wheat germ agglutinin (WGA)-fluorescein isothiocyanate-staining in mouse, showing cardiac myocyte (CM) cross-sectional area (CSA). Scale bars: 20 μm. (G) Quantitative data of CM hypertrophy assessed by CSA; n = 3–6 hearts per group with 150–300 CMs analyzed per heart. (H) qPCR analysis of heart failure genes ANP, normalized to GAPDH. (I) Representative images of heart sections stained with picrosirius red. Red staining shows fibrotic areas. Scale bars: 40 μm. (J) Quantification of total fibrosis. (K) qPCR analysis of fibrotic genes Col1a1, normalized to GAPDH. All data represents the mean ± SEM. Statistics in C, G-H and J-K were performed using a two-way ANOVA and Holm-Sidak post-hoc test. Statistics in E was performed using a repeated measures ANOVA and Holm-Sidak post-hoc test. *P < 0.05 WT/TAC/TP-10 vs. WT/TAC/vehicle; # P < 0.05, ## P < 0.01 WT/TAC/vehicle vs. WT/sham/vehicle. Animal numbers: WT/sham/vehicle: n = 3 in C, E, G-H and J-K; WT/sham/TP-10: n = 4 in C, E, G-H and J-K; WT/TAC/vehicle: n = 7 in C, E, G, n = 5 in H and K, n = 8 in J; WT/TAC/TP-10: n = 7 in C, n = 8 in E, G and J, n = 5 in H and K.

