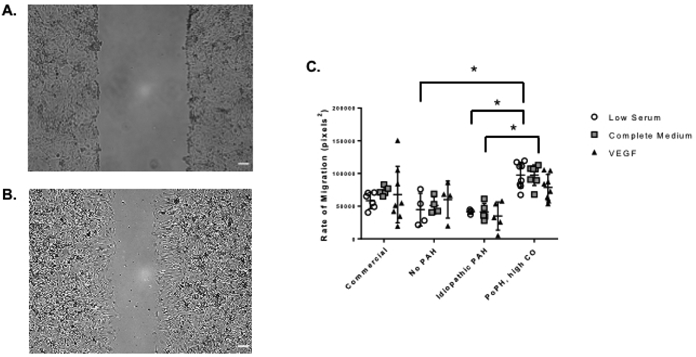
Figure 3.

Migration assessed by scratch assay under low, enriched, and VEGF in low serum conditions. Representative phase image of PAECs at 0 (Panel A) and 6 hours (Panel B) after scratch. Images at 4X magnification. Scale bar = 100 μm. Panel C) Data are presented as mean ± SD. n = 3 – 8; each n is derived from a different passage of cells from a single balloon tipped catheter from one right heart catheterization procedure for a single subject. *p < 0.05. X axis: No PAH = subject 14; idiopathic PAH = subject 18; PoPH, high CO = subject 7. VEGF = vascular endothelial growth factor; PAEC = pulmonary artery endothelial cells; PAH = pulmonary arterial hypertension; PoPH=portopulmonary hypertension; CO=cardiac output.
