
Figure 1. SCA7 transgenic mice exhibit decreased expression of calcium regulatory genes.
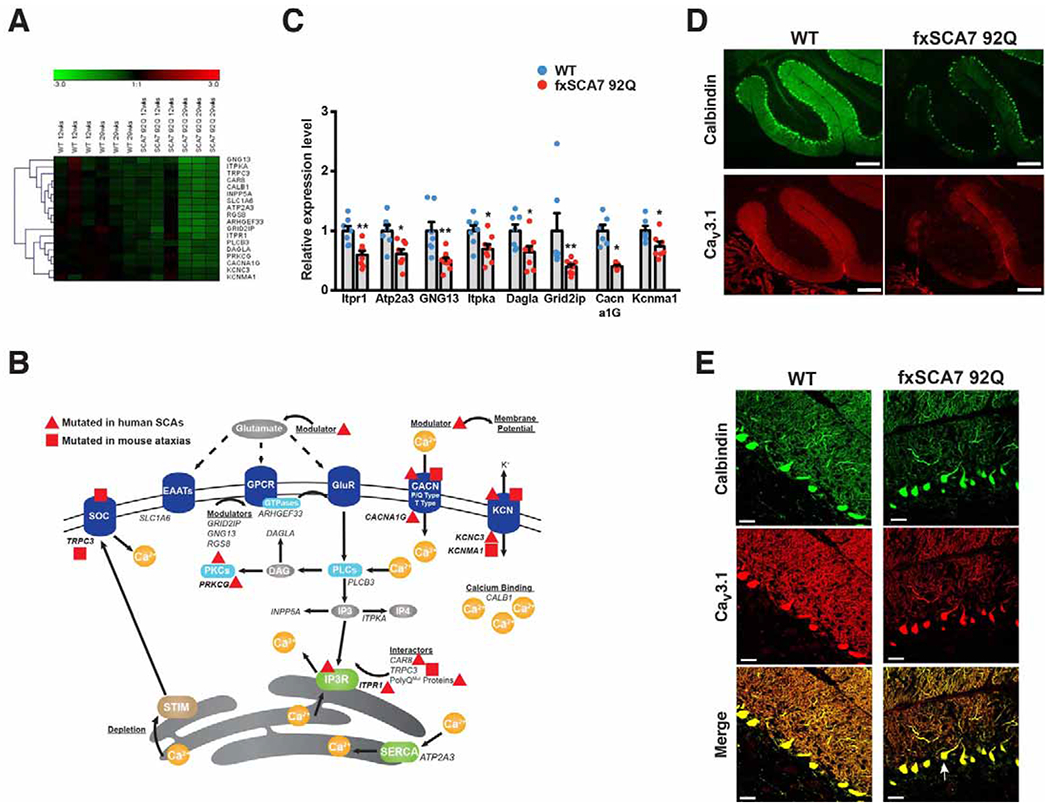
(A) Hierarchical clustering of enriched pathways from DAVID analysis of cerebellar transcriptome data from SCA7 mice and controls (WT) at presymptomatic and symptomatic ages reveals genes involved in calcium signaling and phosphatidyl-inositol signaling. See also Figure S1A and Table S1.
(B) Here we see a diagram of the cell membrane, membrane-based cell signaling pathways, and the ER, indicating proteins involved in regulating calcium homeostasis. Genes that encode these proteins or regulators are shown in italic font. Genes, which when mutated, produce a phenotype of ataxia are shown in bold. A red triangle indicates gene mutations that yield ataxia in humans, while a red square indicates genes that yield ataxia in mice. Note that all listed genes (in italics) were found to be down-regulated in cerebellum of SCA7 transgenic mice.
(C) We performed qRT-PCR analysis on RNA’s isolated from cerebellar tissue from 30 week-old fxSCA7 92Q and WT control mice. WT: n=7, fxSCA7 92Q: n=8; three technical replicates; two-tailed t-test, *P <0.05, ** P <0.01. Error bars = s.e.m.
(D) Representative immunostaining of cerebellar sections from 25 week-old fxSCA7 92Q and WT control mice for calbindin (green) and Cav3.1 (red). Scale bar = 100 μm
(E) Representative higher magnification images of cerebellar sections from 25 week-old fxSCA7 92Q and WT control mice immunostained for calbindin (green) and Cav3.1 (red). Note mislocalization of Purkinje cell soma (arrow). Scale bar = 60 μm. See also Figure S1 and Table S1.