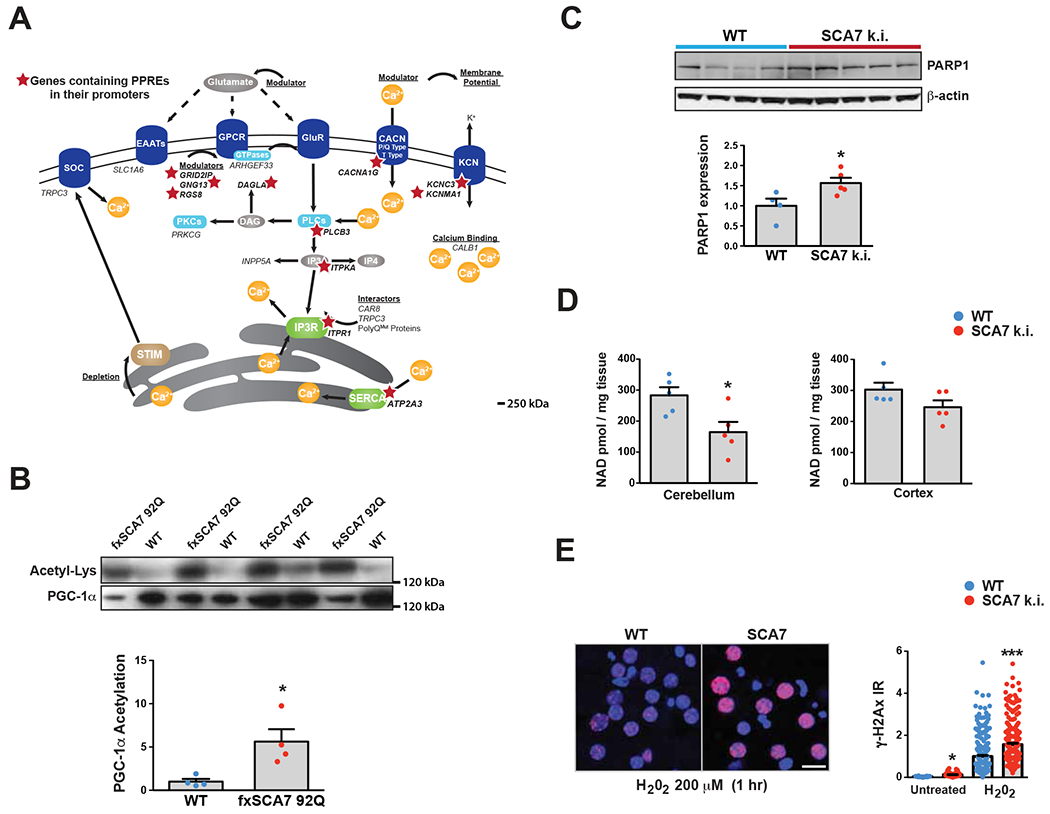
Figure 3. SCA7 transcriptome abnormalities stem from Sirt1 dysfunction secondary to NAD+ depletion.

(A) Here we see a diagram of the cell membrane, membrane-based cell signaling pathways, and the ER, indicating proteins involved in regulating calcium homeostasis and flux. Genes that encode these proteins or regulators are shown in italic font. Red stars demarcate the 11 calcium regulatory genes that contain PPAR response elements (PPREs) in their promoters.
(B) We prepared cerebellar protein lysates from 30 week-old fxSCA7-92Q mice and WT controls, and then performed immunoprecipitation of PGC-1α. Immunoblotting of PGC-1α IP’s with antibodies directed against either anti-acetyl-lysine or anti-PGC-1α was performed, revealing a marked increase in acetylated PGC-1α in SCA7 cerebellum. We quantified these results by densitometry analysis of the acetyl-lysine and PGC-1α bands in the graph below. WT: n=4, fxSCA7 92Q: n=4; two-tailed t-test, *P <0.05.
(C) PARP1 immunoblot analysis of cerebellar protein lysates from 8.5 week-old SCA7 266Q mice and WT controls, quantified by densitometry analysis of PARP1 and β-actin (loading control) bands in the graph below. WT: n=4, SCA7 266Q: n=5; two-tailed t-test, *P <0.05.
(D) Mass spectrometry measurement of NAD+ levels in the cerebellum and cortex of 8.5 week-old SCA7-266Q mice and WT controls. WT: n=5, SCA7 266Q: n=5; two-tailed t-test, *P <0.05.
(E) γH2Ax immunostaining of cortical neurons cultured from SCA7 210Q k.i. mice and WT littermates, at baseline and after 1 hr of H202. LEFT: Representative image set. γH2Ax (red), DAPI (blue). RIGHT: Quantification of γH2Ax+ signal / soma area; n = 3 mice/genotype; n = 3 cultures / mouse; n = 50 neurons / culture; ***P <.001, *P <.05, two-tailed t-test. Scale bar = 20 μm. Error bars = s.e.m.
