
Figure 5. Purkinje neuron membrane excitability is improved upon Sirt1 over-expression.
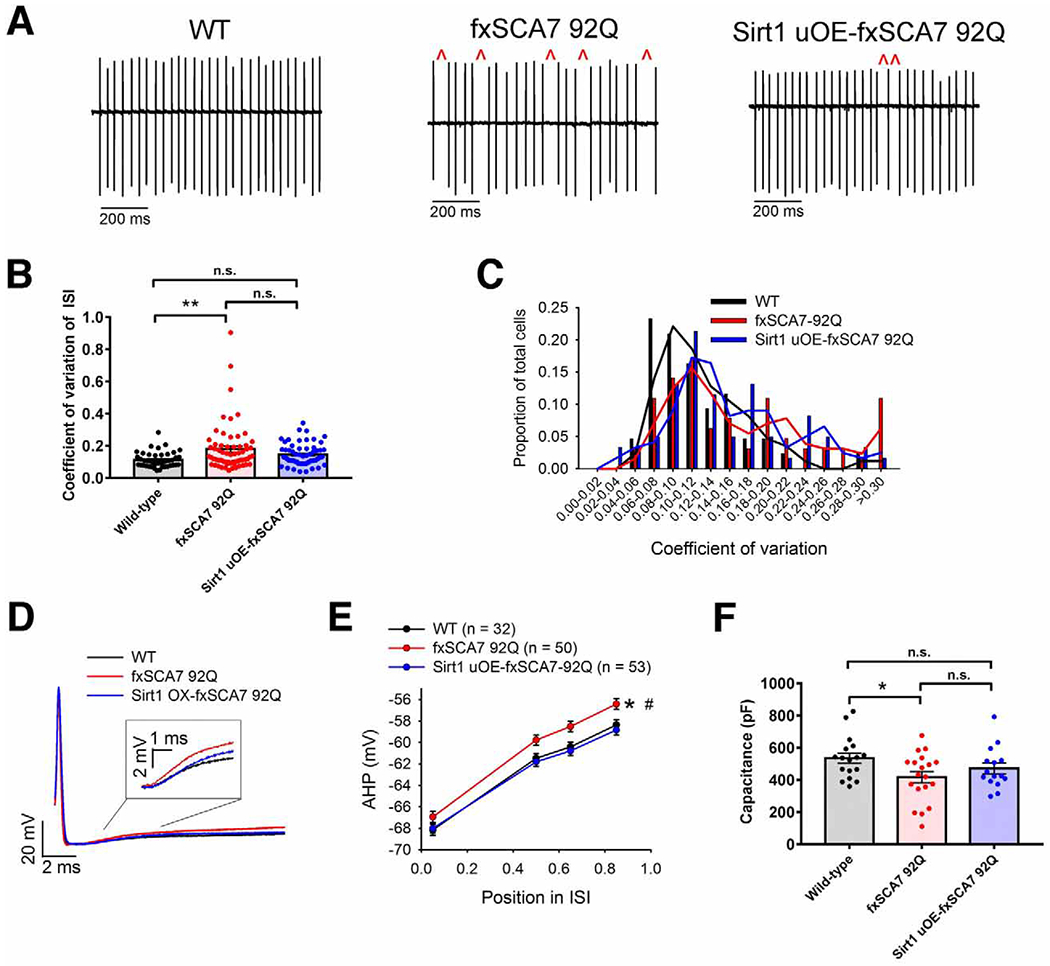
(A) Representative extracellular recordings from acute cerebellar slices of Purkinje cells from ~30 week-old fxSCA7 92Q, Sirt1 uOE-fxSCA7 92Q, and WT mice, illustrating irregular spiking (red carats), which is improved upon Sirt1 over-expression.
(B) Quantification of data from (A) for fxSCA7 92Q mice (n = 11), Sirt1 uOE-fxSCA7 92Q mice (n = 9), and WT mice (n = 8), indicating the CV of the ISI of Purkinje cell firing from the nodular zone of the cerebellum. WT cells: n=43, fxSCA7 92Q cells: n=64, Sirt1 uOE-fxSCA7 92Q cells: n=61; one-way ANOVA with Holm-Sidak post-test, *P <0.05, n.s. = not significant.
(C) Distribution of ISI CV of Purkinje cell firing from fxSCA7 92Q, Sirt1 uOE-fxSCA7 92Q, and WT mice, showing a shift of the distribution towards WT in Sirt1 uOE-fxSCA7 92Q mice.
(D) Overlaid whole-cell patch-clamp traces of individual spikes from Purkinje cells in the nodular zone of the cerebellum of fxSCA7 92Q, Sirt1 uOE-fxSCA7 92Q, and WT mice at ~30 weeks of age, illustrating greater AHP decay in fxSCA7 92Q Purkinje cells, which is normalized in Sirt1 uOE-fxSCA7 92Q Purkinje cells.
(E) Quantification of data from (D) for fxSCA7 92Q mice (n = 11), Sirt1 uOE-fxSCA7 92Q mice (n = 9), and WT mice (n = 8), measuring the decay of Purkinje cell spike-AHP. The AHP amplitude was measured at defined points in the Inter Spike Interval (ISI): maximal AHP, mean ISI*0.5, mean ISI*0.65, and mean ISI*0.85. WT cells: n=32, fxSCA7 92Q cells: n=50, Sirt1 uOE-fxSCA7 92Q cells: n=53; two-way ANOVA with Holm-Sidak post-test, *P <0.05: fxSCA7 92Q compared to WT; #P <0.01: fxSCA7 92Q compared to Sirt1 uOE-fxSCA7 92Q.
(F) In acute cerebellar slices from 35 week-old fxSCA7 92Q mice (n = 5), Sirt1 uOE-fxSCA7 92Q mice (n = 6), and WT mice (n = 7), we measured total Purkinje cell capacitance, which is a function of membrane surface area, in the nodular zone of the cerebellum. WT cells: n=17, fxSCA7 92Q cells: n=19, Sirt1 uOE-fxSCA7 92Q cells: n=15; one-way ANOVA with Hold-Sidak post-test, *P <0.05, n.s. = not significant. Error bars = s.e.m. See also Figure S6.