
Figure 6. Nicotinamide riboside and Sirt1 rescue disease phenotypes in SCA7 mice and patient neurons.
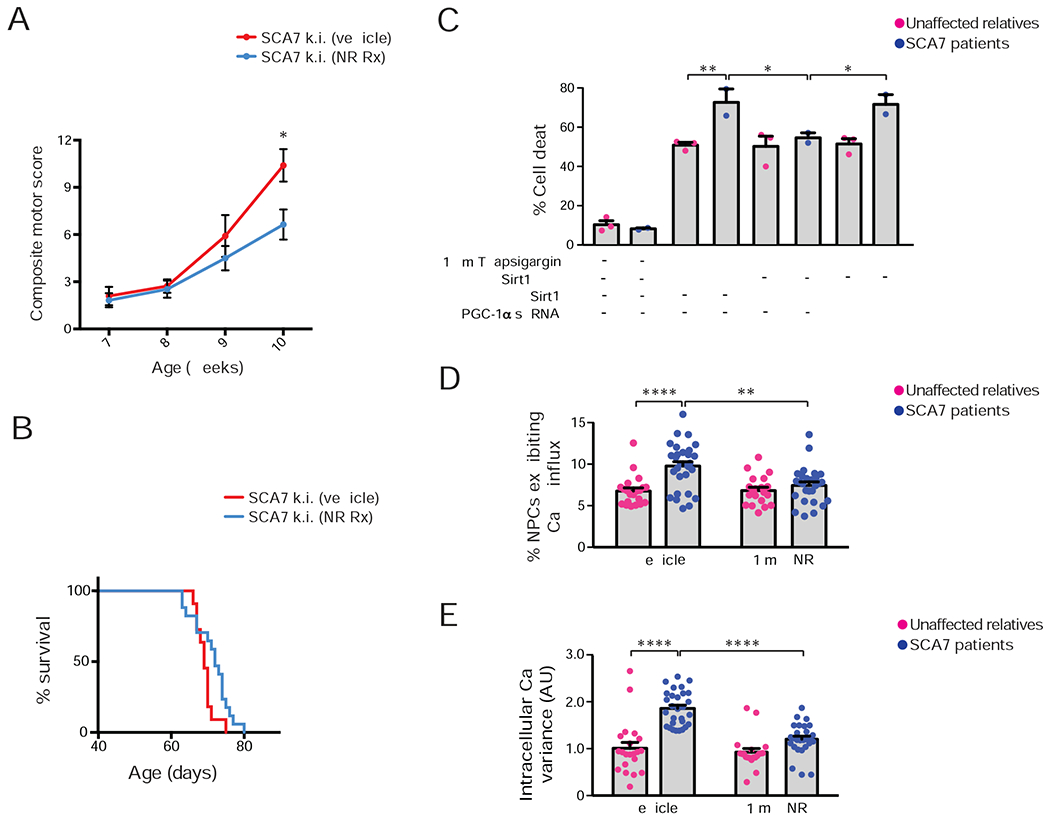
(A) We performed a neurological screening battery on cohorts of SCA7 266Q knock-in mice (n = 11 – 17 / group), maintained on a diet supplemented with nicotinamide riboside (NR) or vehicle, at the indicated ages. Two-tailed t-test, *P<0.05.
(B) Kaplan-Meier plot of SCA7-266Q mice. Vehicle-supplemented diet: n = 11, NR-supplemented diet: n = 17; log-rank test, P <0.05.
(C) We cultured NPCs from SCA7 patients and related, unaffected controls (n = 2 individuals / genotype), treated and/or transfected the cultures as indicated, and quantified cell death. Three technical replicates; two-way ANOVA with post-hoc Tukey test, *P <0.05, **P <0.01.
(D) We cultured NPCs from a SCA7 patient and related, unaffected control in the presence of 1 mM NR or vehicle, performed live cell imaging with a calcium-sensitive dye after 100 mM KCl depolarization, and quantified NPCs that exhibited a sustained increase in calcium concentration. Two unique clones / individual; two technical replicates; two-tailed t-test, ****P <0.0001.
(E) We cultured NPCs from a SCA7 patient and related, unaffected control in the presence of 1 mM NR or vehicle, performed live cell imaging with a calcium-sensitive dye after 100 mM KCl depolarization, and calculated the variance of the resulting calcium amplitude curve. Two unique clones / individual; two technical replicates; two-tailed t-test, ****P <0.0001. Error bars = s.e.m.