
Fig. 4. Mdm4TM/TM mice die perinatally but can be rescued by p53 loss or haploinsufficiency.
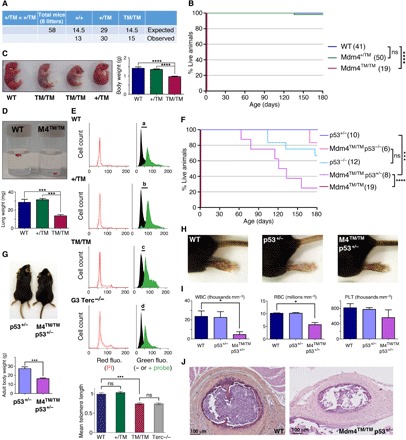
(A) Mendelian distribution of the offspring from 8 Mdm4+/TM intercrosses. (B) Mdm4TM/TM mice die at birth. Cohort sizes are in parentheses. (C) Mdm4TM/TM neonates are smaller than their littermates and appear hypoxic. (D) Lungs from Mdm4TM/TM P0 pups are hypoplastic and sink in phosphate-buffered saline owing to a lack of air inflation. (E) Flow-FISH analysis of P0 lung cells with a telomere-specific peptide nucleic acid (PNA) probe. Top: Representative results from a WT, a Mdm4+/TM, a Mdm4TM/TM, and a G3 Terc−/− mouse are shown. Right: Green fluorescence (fluo.) with black histograms for cells without the probe (measuring cellular autofluorescence) and green histograms for cells with the probe. The shift in fluorescence intensity is smaller in Mdm4TM/TM and Terc−/− cells (c or d < a or b), indicating reduced telomere length. Left: Propidium iodide (PI) fluorescence histograms are superposed for cells with or without the probe. Below: Statistical analysis of green fluorescence shifts (see Materials and Methods). Means + 95% CI are shown; data are from two to three mice and >3800 cells per genotype. (F) Impact of decreased p53 activity on Mdm4TM/TM animals. Cohort sizes are in parentheses. (G) Examples of littermates with indicated genotypes. (H) Hind legs of mice with indicated genotypes. (I) Mdm4TM/TM p53+/− mice exhibit abnormal hemograms. Counts for white blood cells (WBC), red blood cells (RBC), and platelets (PLT) for age-matched (120 days old) animals are shown. (J) Hematoxylin and eosin staining of sternum sections from WT and Mdm4TM/TM p53+/− mice. In relevant panels: ns, not significant; *P < 0.05, ***P < 0.001, and ****P < 0.0001 by Mantel-Cox (B and F), Student’s t (C, D, G, and I), or Mann-Whitney (E) statistical tests. Photo credits: E.T. and R.D., Institut Curie (C, G, and H); R.D., Institut Curie (D).