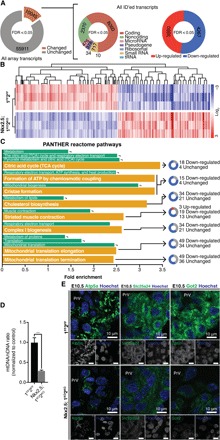
Fig. 2. Primitive heart tubes lacking Hdac1 and Hdac2 exhibit down-regulation of metabolic gene programs.

(A) Analysis of differentially regulated transcripts at various levels. (B) Heatmap of identified, differentially regulated transcripts grouped by Spearman clustering. (C) Top enriched PANTHER reactome terms (gold) with parent categories (green). Doughnuts show distribution of transcript changes. (D) Mitochondrial DNA (mtDNA) quantification relative to nuclear DNA (nDNA) in Nkx2.5;1KO2KO and 1FF2FF E10.5 PHTs. (E) Atp5a, Slc25a24, and Got2 staining on Nkx2.5;1KO2KO and 1FF2FF E10.5 sagittal sections at AVC level with Hoechst nuclear counterstain. Grayscale images are unedited. tRNA, transfer RNA.
