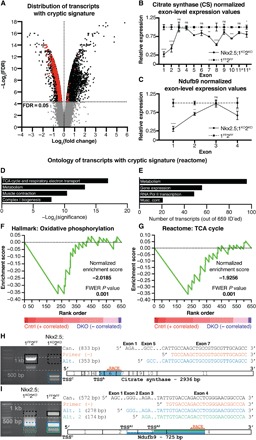
Fig. 3. Hdac1 and Hdac2 suppress cryptic transcription during cardiogenesis.

(A) Distribution of differentially regulated transcripts (black), differentially regulated transcripts with a cryptic signature (red), and unchanged transcripts (gray) in Nkx2.5;1KO2KO compared with 1FF2FF E10.5 PHTs. (B and C) Normalized exon-level expression values for citrate synthase (CS; B) and Ndufb9 (C) in Nkx2.5;1KO2KO and 1FF2FF E10.5 PHTs. (D to G) PANTHER analysis (D and E) and Gene Set Enrichment Analysis (GSEA) (F and G) of differentially regulated, identified cryptic transcripts. (H and I) 5′ rapid amplification of complementary DNA (cDNA) ends (5′RACE) for CS (F) and Ndufb9 (E). Left: 5′RACE products (black, canonical; blue/green, alternative). Right: Alignment of sequenced products. TSSC, canonical TSS; TSSA#, alternative TSS; ns, not significant; FWER, Family-wise error rate; Pol II, polymerase II.
