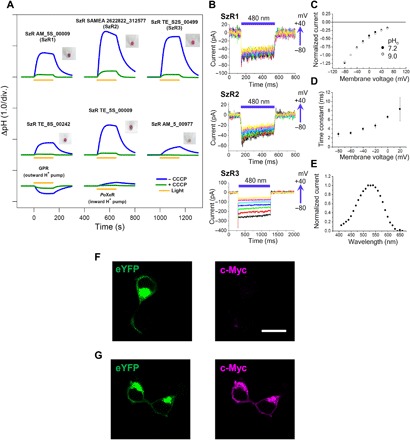
Fig. 2. Light-driven active inward H+ transport by SzR.

(A) Ion transport activity assay of SzRs in E. coli cells. The cells were illuminated with light (λ > 500 nm) for 150 s (yellow line). The pictures of the pellets of E. coli cells expressing each SzR are shown next to the corresponding results. (B) Electrophysiological measurements of SzR-driven photocurrent in ND7/23 cells. The cells were illuminated with light (λ = 480 nm, 12.3 mW/mm2) during the time region shown by blue bars. The membrane voltage was clamped from −80 to +100 mV for every 20-mV step. (C to E) I-V plot at pHo 7.2 and 9.0 (C), membrane-voltage dependence of the off-kinetics time constant (D), and action spectrum (E) of the current of SzR3. For action spectrum measurement, the light intensity of each wavelength was adjusted to 0.2 mW/mm2. (F and G) eYFP fluorescence (left, green) and immunofluorescence staining observation of SzR1 with a c-Myc epitope tag at the C terminus in cultured ND7/23 cells (right, magenta) in unpermeabilized (F) and permeabilized conditions with detergent (Triton X-100) (G). Scale bar, 20 μm.
