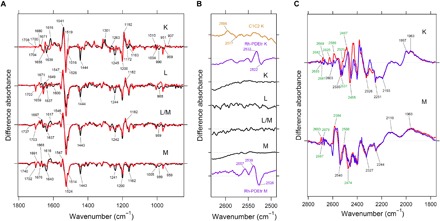
Fig. 5. Light-induced low-temperature difference FTIR spectroscopy of SzR1.

(A and B) Light-induced low-temperature K-minus-dark, L-minus-dark, L/M-minus-dark, and M-minus-dark difference FTIR spectra of SzR1 obtained at T = 110, 190, 210, and 230 K, respectively, in the 1800 to 850 (A) and 2630 to 2490 (B) cm−1 regions. In (B), the light-induced low-temperature K-minus-dark FTIR spectra of C1C2 and Rh-PDEtr and low-temperature M-minus-dark FTIR spectrum of Rh-PDEtr were reproduced from (18) and (28). (C) Light-induced low-temperature K-minus-dark and M-minus-dark difference FTIR spectra of SzR1 obtained at T = 110 and 230 K, respectively, in the 2800 to 1760 cm−1 region. The normalization factors multiplied to each spectrum are listed in tables S2 and S3.
