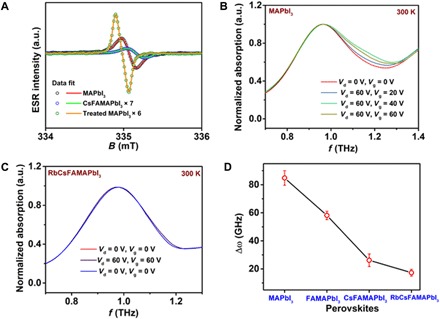
Fig. 3. Spectroscopic characterization of defect states.

(A) Derivative ESR spectra data (scatter) and best fits (line) measurement at 40 K performed on different perovskite samples. Representative THz absorption spectra measured on a bottom contact bottom gate transistor (L = 80 μm, W = 19.5 cm) fabricated using (B) MAPbI3 (C) RbCsFAMAPbI3, perovskite under different biasing conditions illustrating the broadening of the phonon mode. (D) Plot of the bias induced broadening of the first phonon peak around 1 THz in different perovskite materials. Bias-induced broadening is estimated from the difference in the FWHM for THz absorption spectra measured at Vd = Vg = 0V and Vd = Vg = 60V after a Gaussian fit.
