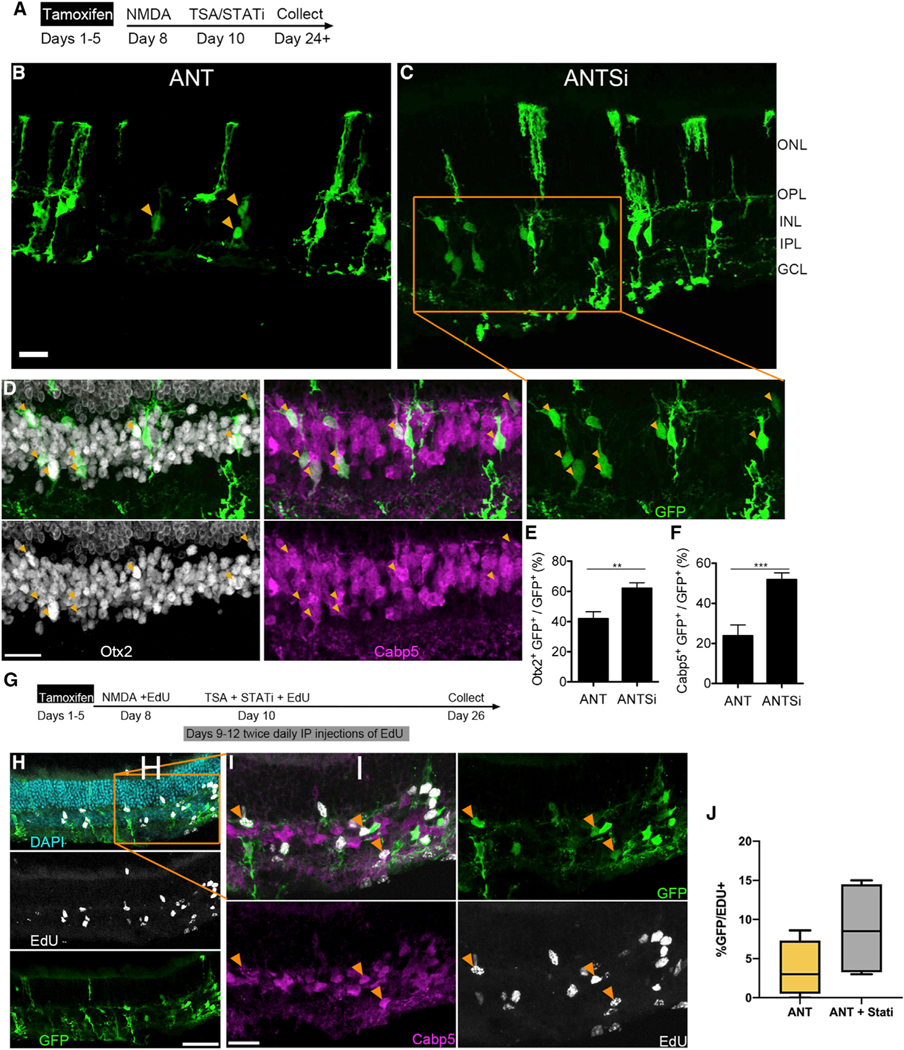
Figure 1. STAT Pathway Inhibition Increases the Number of Müller Glial-Derived Neurons.

(A) Experimental paradigm for increasing Müller Glial (MG)-derived regeneration efficiency. Tamoxifen is administered for up to 5 consecutive days, followed by NMDA damage a few days after tamoxifen, followed by administration of TSA and/or STAT inhibition a couple days after damage. Retinas were collected a minimum of 2 weeks after TSA/STATi.
(B) Representative image showing ANT-treated adult retina with MG-derived neurons.
(C) Representative image showing ANTSi-treated adult retina with increased number of MG-derived neurons. Scale bars for (B) and (C), 20 μm. ONL, outer nuclear layer; OPL, outer plexiform layer; INL, inner nuclear layer; IPL, inner plexiform layer; GCL, ganglion cell layer.
(D) Shows enlargement of ANTSi-treated retinas from (C). Orange arrows indicate Cabp5+ Otx2+ GFP+ cells. All images are flattened z stacks.
(E) Quantification of Otx2 in ANT (n = 16) and ANTSi-treated (n = 13) retinas.
(F) Quantification of Cabp5 in ANT-treated (n = 6) and ANTSi-treated (n = 8) retinas. ANT versus ANTSi treatments in (E) and (F) were significantly different by unpaired t test at **p = 0.0023 and ***p = 0.0006, respectively.
(G) Experimental paradigm for testing where ANTSi-treated MG proliferate prior to neurogenesis.
(H) Representative image from proliferation experiment showing EdU and GFP colocalization.
(I) Enlargement of (H) highlighting GFP+ EdU+ Cabp5+ MG-derived neurons (orange arrows). Scale bars for (H) and (I), 50 and 20 μm, respectively.
(J) Quantification of Edu+ GFP+ cells. Box plot illustrates mean, upper quartile, and lower quartile.
