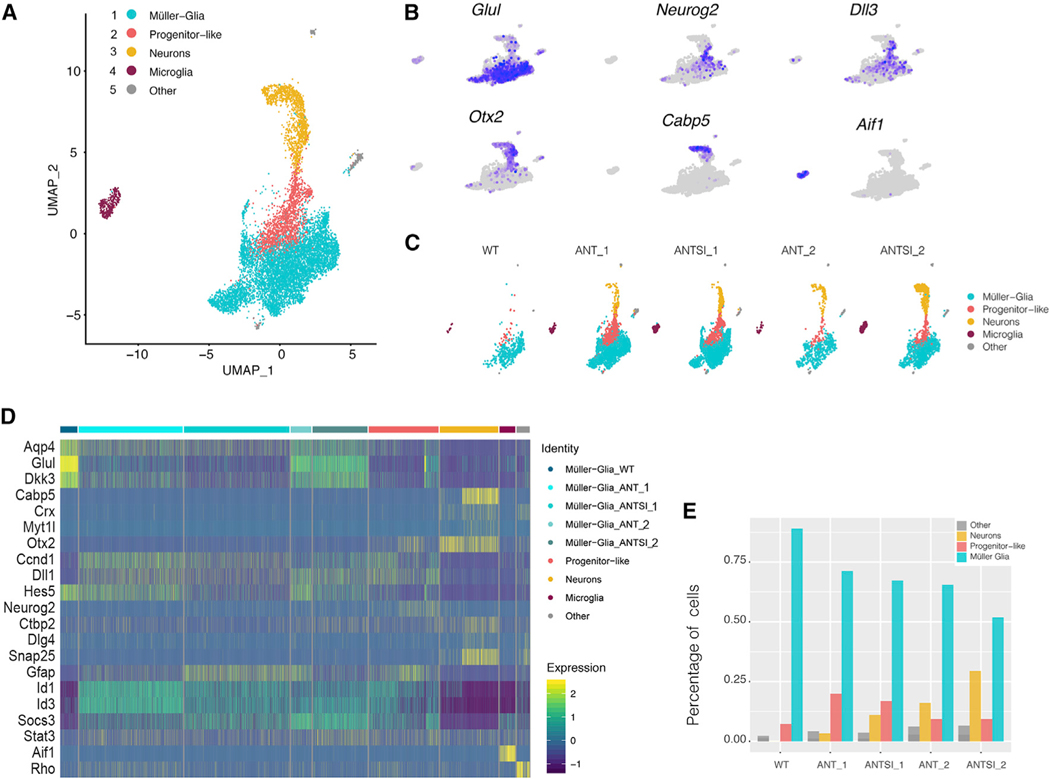
Figure 3. ANTSi Treatment Results in More Müller Glial-Derived Neurons by scRNA-Seq.
(A) A UMAP plot of FACS-purified WT Müller Glia (MG) and ANT-treated (and ANTSi-treated) MG. Five clusters were identified in the combined data.
(B) Feature plots of glial (Glul), progenitor (Dll1), neuronal (Cabp5 and Otx2), rod (Rho), and microglial (Aif1) gene expression to identify clusters by cell type. Cells expressing each gene are labeled purple; gray cells had expression of the gene below threshold of detection.
(C) UMAP plot from (A) colored by treatment condition. Note neurons (yellow) only appear in the ANT and ANTSi conditions.
(D) Heatmap showing all cells from the five treatment conditions: WT FACS-purified MG (WT), ANT-treated MG 2 days (ANT_1) and 6 weeks (ANT_2) following the last intraocular injection, and ANTSi-treated MG 2 days (ANTSi_1) and 3 weeks (ANTSi_2) after the last intraocular injection, respectively. Müller Glial (MG)-derived neurons express synaptic genes (e.g., Snap25, Dlg4) and do not express Stat pathway targets (e.g., Socs3, Id1/3, Gfap). Progenitor-like cells highly express Stat pathway targets. Scale shows log2 expression.
(E) Graph showing the fraction of each treatment that was composed of MG, progenitor-like cells, and MG-derived neurons. ANTSi treatment increases the proportion of MG-derived neurons and decreases the proportion of progenitor-like cells relative to ANT treatment.

