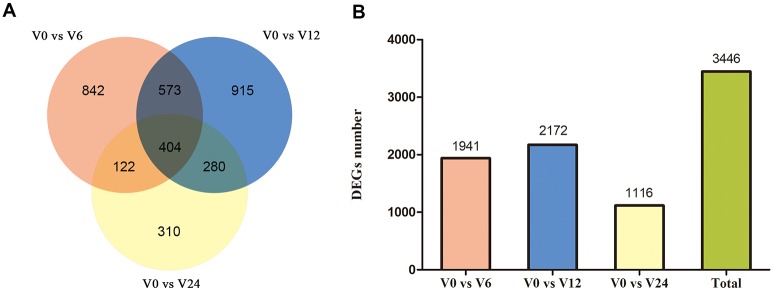
Fig 2. Differentially expressed genes in the V. coralliilyticus-infected samples compared to sample V0.
(A) Venn diagram visualizes overlapping transcripts between V0 vs. V6, V0 vs. V12 and V0 vs. V24 transcriptomes. The different circles represent comparisons of different samples. The numbers in the fields describe the number of transcripts that the three analyzed groups of DEGs have in common at a given intersection. (B) Numbers of DEGs in V0 vs. V6, V0 vs. V12, V0 vs. V24 and total.

