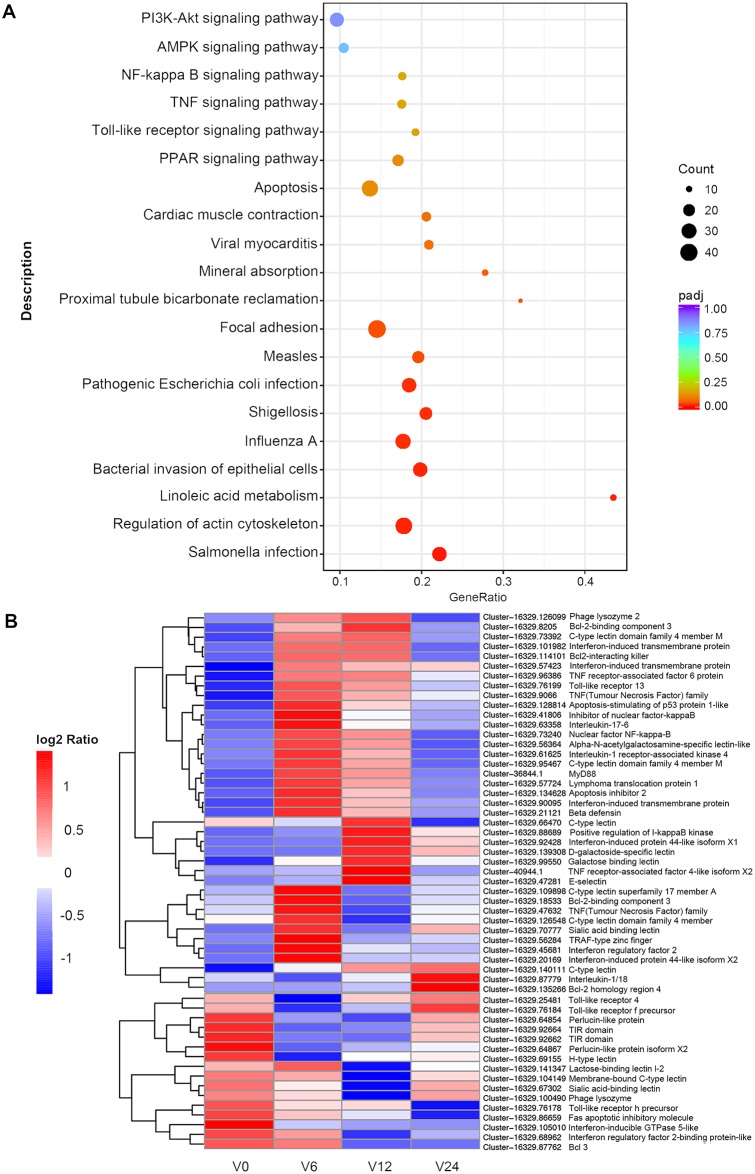
Fig 3. Differentially expressed genes analysis.
(A) KEGG pathway enrichment analysis of DEGs in T. crocea hemocytes exposed to V. coralliilyticus. The enrichment factor is the ratio of the DEG number and the number of all genes in a certain enrichment pathway. The dot size denotes the number of DEGs, while colors correspond to the adjusted p-value range. (B) A heat map shows immune-related differentially expressed T. crocea transcripts. The heat map shows expression profiles of healthy T. crocea at 0 h, 6 h, 12 h and 24 h after V. coralliilyticus challenge. Color intensity is proportional to the magnitude of changes. Relative expression levels are shown in red (upregulation) and blue (downregulation).

