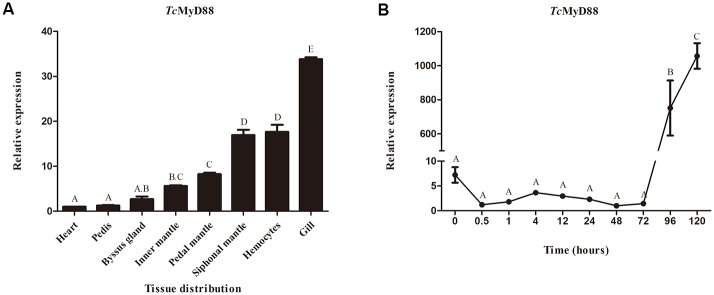
Fig 5. Expression pattern of TcMyD88.
(A) The expression patterns of TcMyD88 in different tissues were examined by qRT-PCR. The relative expression levels were normalized to β-actin. Significant differences are indicated by different letters. (B) Relative expression levels of TcMyD88 in different embryonic stages. β-actin was employed as an internal control. Error bars indicate standard error.

