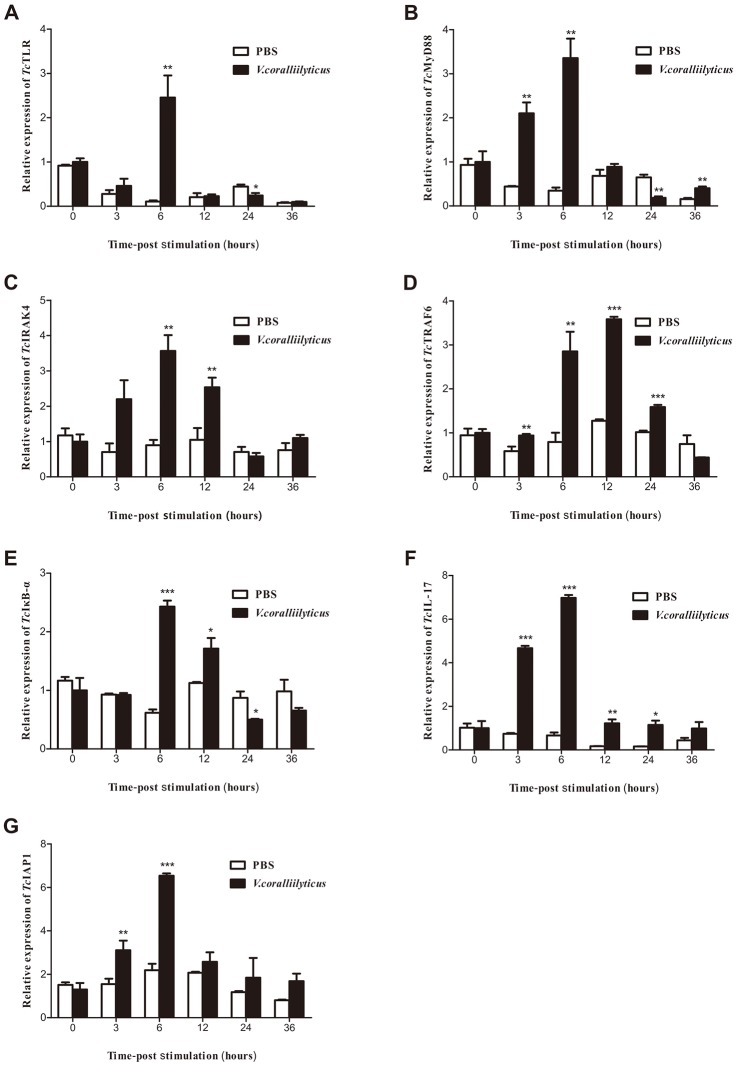
Fig 8. Time-course expression analysis of TLR pathway-related genes in hemocytes from V. coralliilyticus-challenged T. crocea.
Expression profiles of TLR (A), MyD88 (B), IRAK4 (C), TRAF6 (D), IкB-α (E), IL-17 (F) and IAP1 (G) in hemocytes from V. coralliilyticus-challenged T. crocea. All of the samples were analyzed in triplicate. The β-actin gene was used as a reference gene to normalize expression levels between the samples. Statistical significance was determined by Student’s t-tests and is indicated by an asterisk (*p < 0.05, **p < 0.01 and ***p < 0.001).

