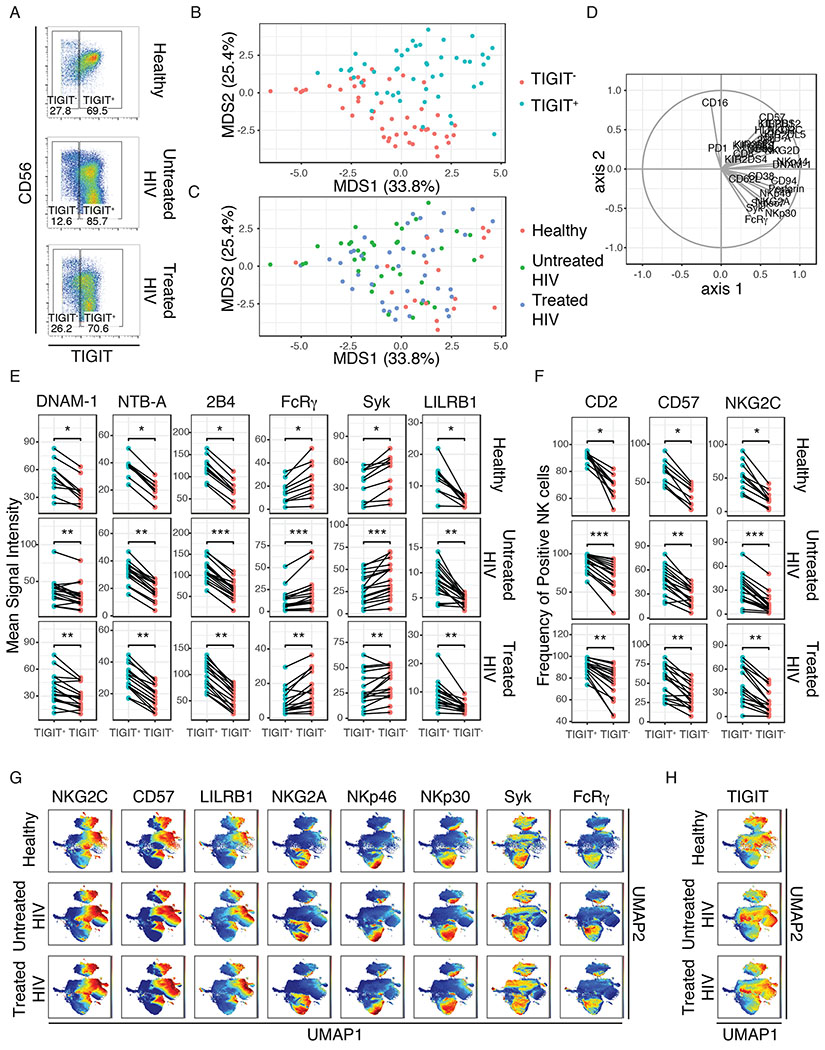
Figure 4. TIGIT expression is increased in adaptive/mature NK cells.
(A) Representative CyTOF plots of gating for TIGIT+ and TIGIT− NK cells from healthy women (n=9), untreated HIV+ women (n=17), treated HIV+ women (n=16). (B) Multidimensional Scaling (MDS) of TIGIT+ and TIGIT− NK cells colored by TIGIT expression. (C) MDS of TIGIT+ and TIGIT− NK cells colored by group (Healthy, Untreated HIV and Treated HIV). (D) Vectors driving the variance of the MDS. (E) Mean Signal Intensity of DNAM-1, NTB-A, 2B4, FcRγ, Syk and LILRB1 expression in TIGIT+ and TIGIT− NK cells from healthy women, untreated HIV+ women and treated HIV+ women. (F) Frequency of CD2+, CD57+ and NKG2C+ NK cells from TIGIT+ and TIGIT− NK cells from healthy women, untreated HIV+ women and treated HIV+ women. (G) UMAP plot of pooled NK cells from healthy women, untreated HIV+ women and treated HIV+ women colored by markers of adaptive/mature NK cells (NKG2C, CD57, LILRB1, NKG2A, NKp46, NKp30, Syk, FcRγ) . (H) UMAP plot of pooled NK cells from healthy women, untreated HIV+ women and treated HIV+ women, colored by TIGIT expression. * = adjusted p-value≤0.05, ** = adjusted p-value≤0.01, *** = adjusted p-value≤0.001.

