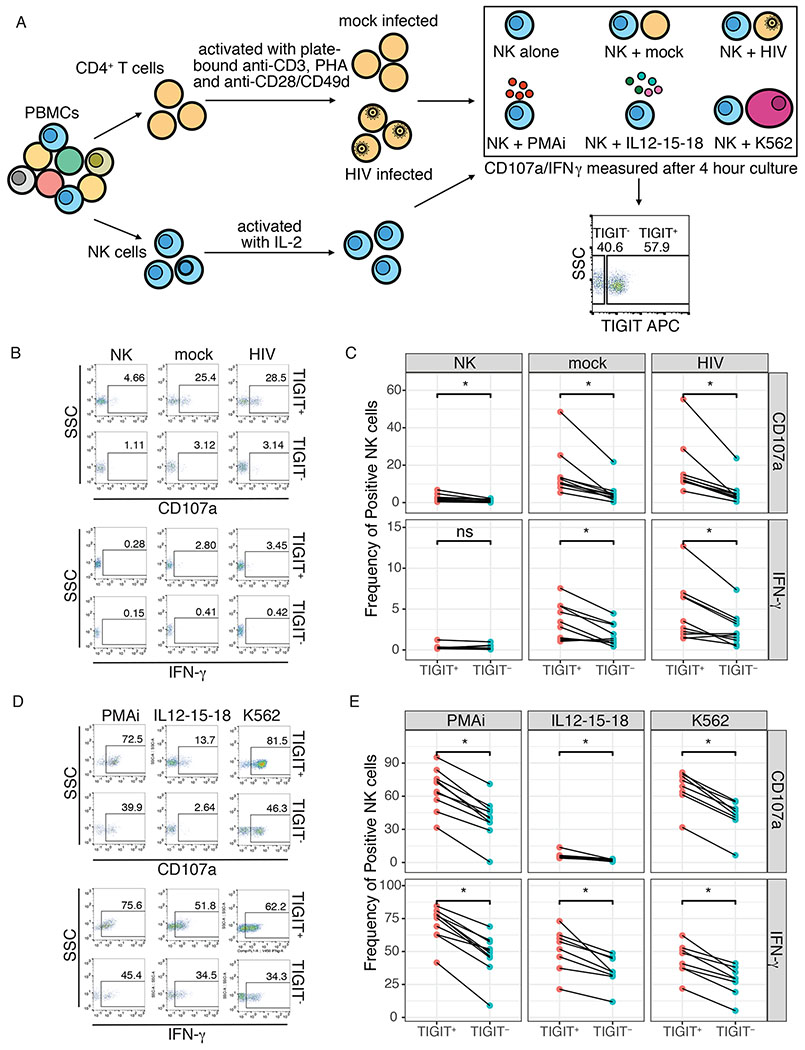
Figure 5. TIGIT expression is associated with increased NK cell responses.
(A) Schematic of CD4+ T cell:NK cell co-cultures or stimulation and representative flow cytometry plot of gating of TIGIT+ and TIGIT− NK cells. (B) Representative flow cytometry plots of CD107a and IFN-γ production, expressed as frequency of positive cells, by TIGIT+ and TIGIT− NK cells after 4 hour co-culture with mock-infected (mock) or HIV-infected (HIV) autologous CD4+ T cells. (C) Summary plot of the frequency of TIGIT-gated CD107a+ and IFN-γ+ NK cells after 4 hour co-culture with mock-infected or HIV-infected autologous CD4+ T cells. (D) Representative flow cytometry plots of CD107a and IFN-γ production by TIGIT+ and TIGIT− NK cells after 4 hour stimulation with PMA/ionomycin (PMA/i), a cocktail of IL12, IL-15 and IL-18 (IL12-15-18) or the leukemia cell line K562 (K562). (E) Summary plot of the frequency of TIGIT-gated CD107a+ and IFN-γ+ NK cells after 4 hour stimulation with PMA/ionomycin (PMA/i), a cocktail of IL12, IL-15 and IL-18 (IL12-15-18) or the leukemia cell line K562 (K562). * = adjusted p-value≤0.05, ns = non-sigificant.

