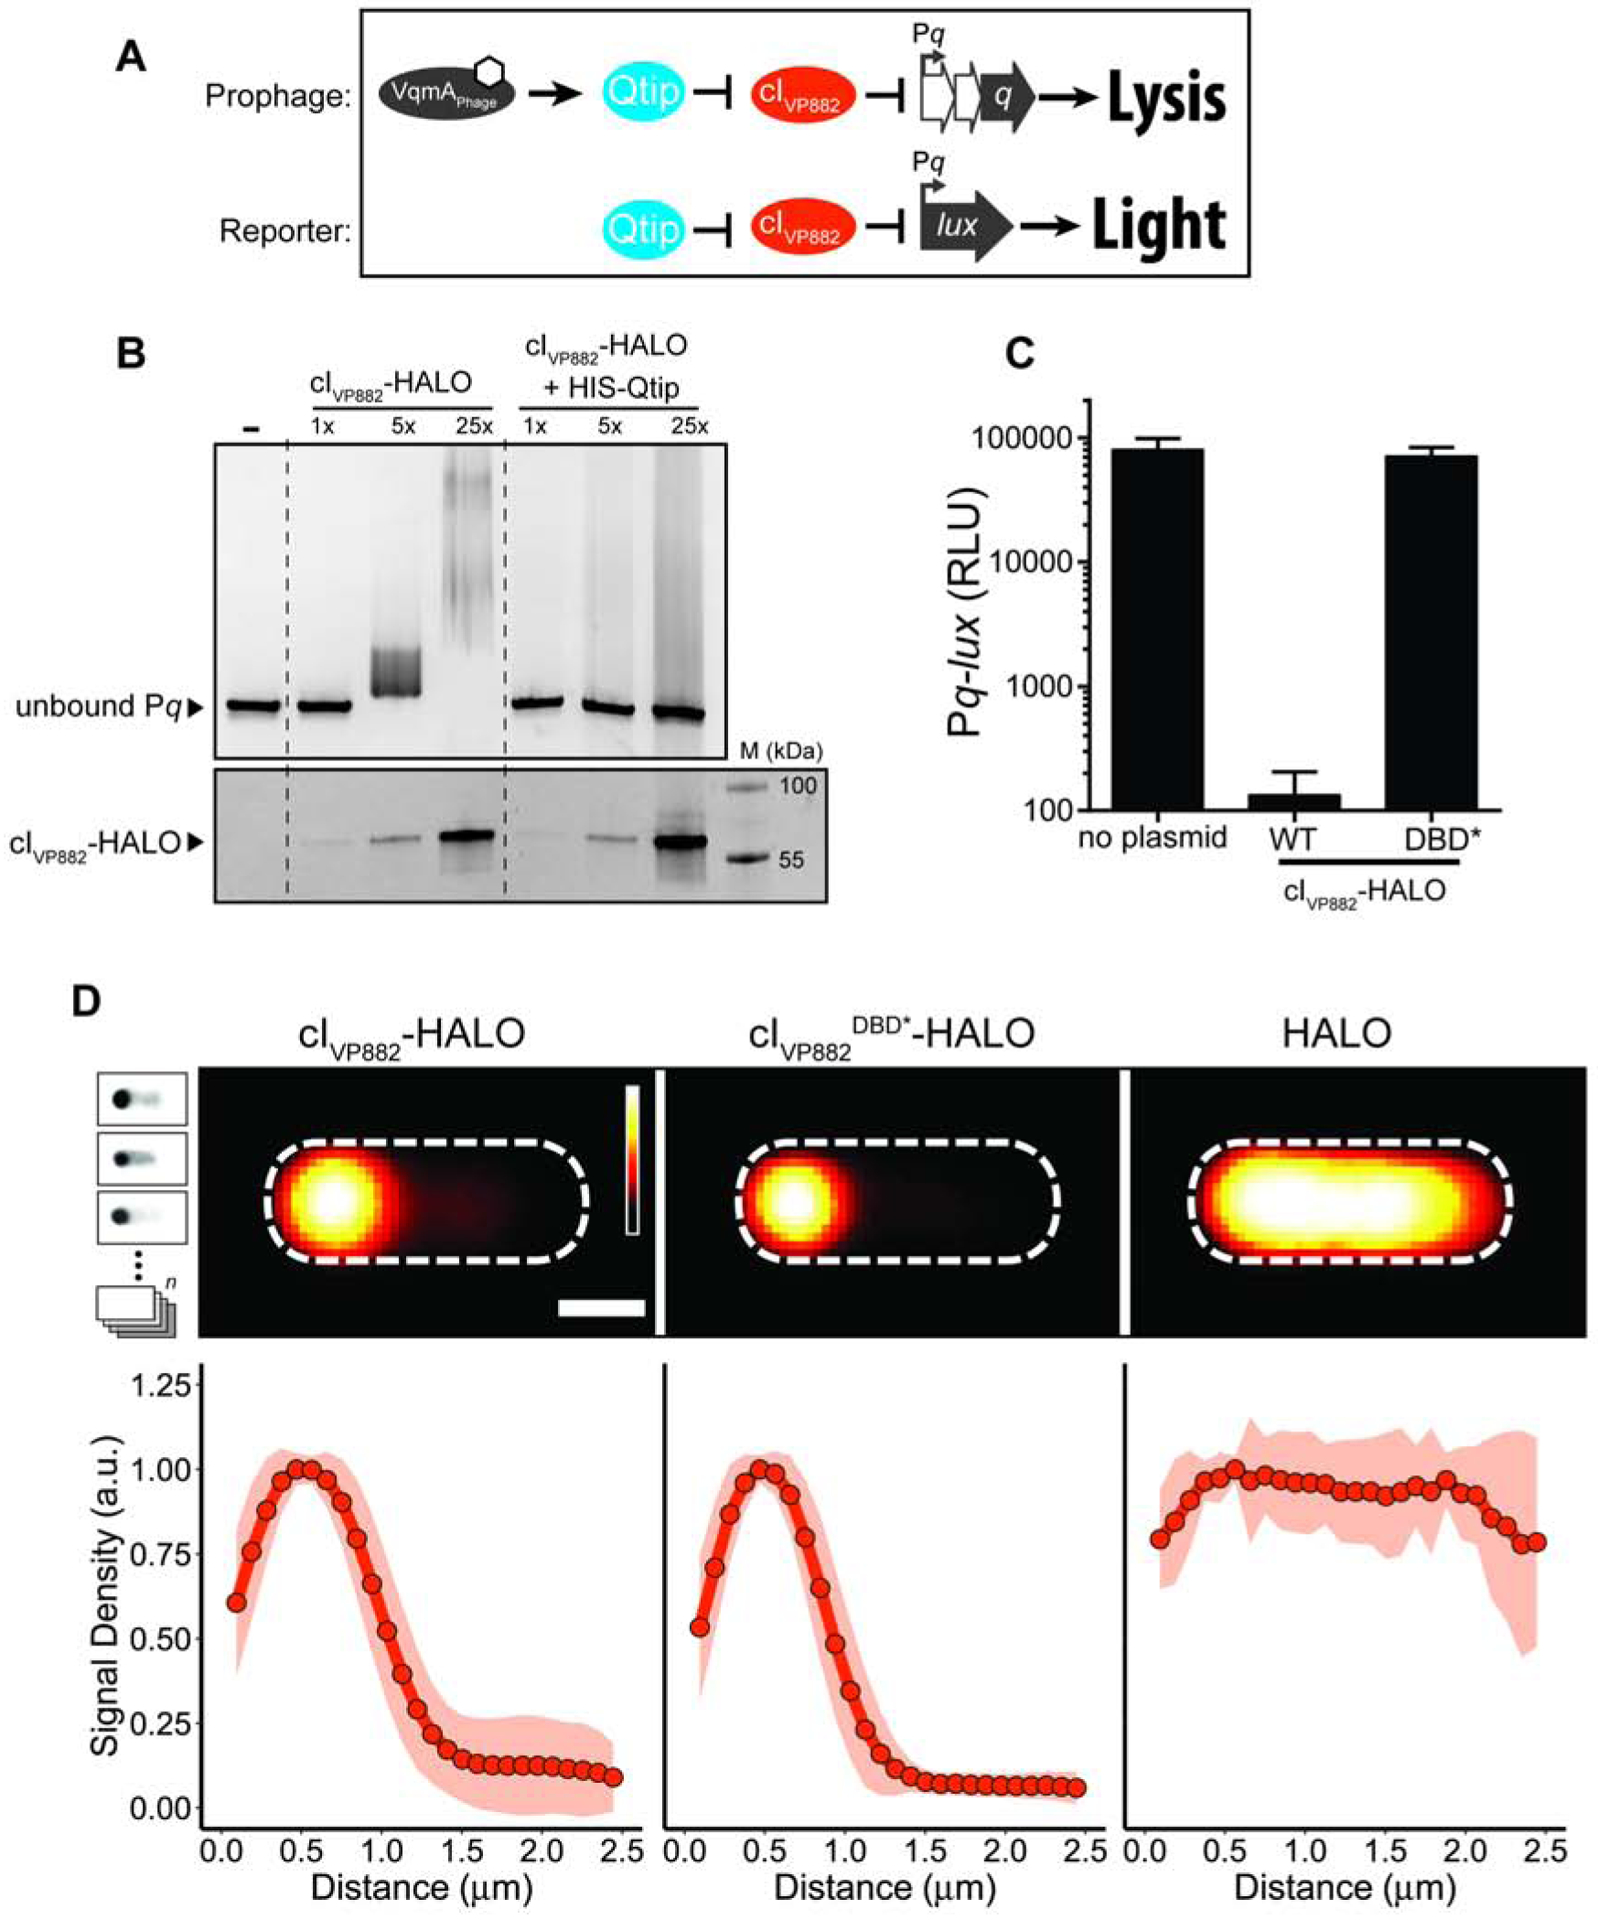
Figure 1. cIVP882 DNA binding is blocked by Qtip but a cIVP882 mutant lacking DNA-binding capability does not prevent Qtip recognition.

(A) Schematic depicting the phage VP882-encoded QS pathway and the reporter system used in this work. Top: VqmAPhage, when bound to DPO (white hexagon), activates expression of the qtip gene encoding the Qtip antirepressor. Qtip inactivates the cIVP882 repressor, enabling expression of Pq and subsequent Q-mediated host cell lysis. Bottom: The reporter system used in this work to monitor Qtip and cIVP882 activity. Pq is fused to the luciferase operon (lux). Light production is low when the cIVP882 repressor is functional and light production is high when Qtip is active and/or the cIVP882 repressor is non-functional. (B) Upper panel: EMSA analysis of Pq DNA retarded by cIVP882-HALO protein purified alone or in complex with HIS-Qtip. The relative amount of cIVP882-HALO in each lane is indicated (1x = ~12 nM). Lower panel: The reactions from the upper panel were subjected to SDS-PAGE analysis and imaged using a Cy5 filter set to visualize HALO-Alexa660, to which the cIVP882-HALO protein had been conjugated. The molecular weight marker is designated M. (C) Light production from E. coli harboring the Pq-lux reporter (no plasmid) or the Pq-lux reporter and a plasmid encoding WT cIVP882 or the cIVP882DBD*-HALO allele. Relative light units (RLU) were calculated by dividing bioluminescence by OD600. Data represented as mean ± SD with n = 3 biological replicates. (D) Upper panel: Average individual cell images of recombinant E. coli producing Qtip and either, cIVP882-HALO, cIVP882DBD*-HALO, or the HALO tag. HALO-TMR fluorescence intensity is displayed as a red heat map (black and white reflect the lowest and highest intensity, respectively). Dashed lines denote the average cell outlines. Scale bar = 1 μm. Upper left inset: Schematic showing aligned individual cells averaged to produce composite images in the upper panel (n = 20–25 cells per condition, see Methods). In the schematic, the HALO-TMR fluorescence intensity from three representative individual cells harboring Qtip and cIVP882DBD*-HALO is shown in inverted greyscale. Lower panel: Line plots of HALO-TMR fluorescence intensity extracted from individual cell images used to generate the composite images displayed in the upper panel. The distance along the x-axis is relative to the left most edge of each cell. Shaded regions represent ± 1 SD from the mean. See also Figure S1.
