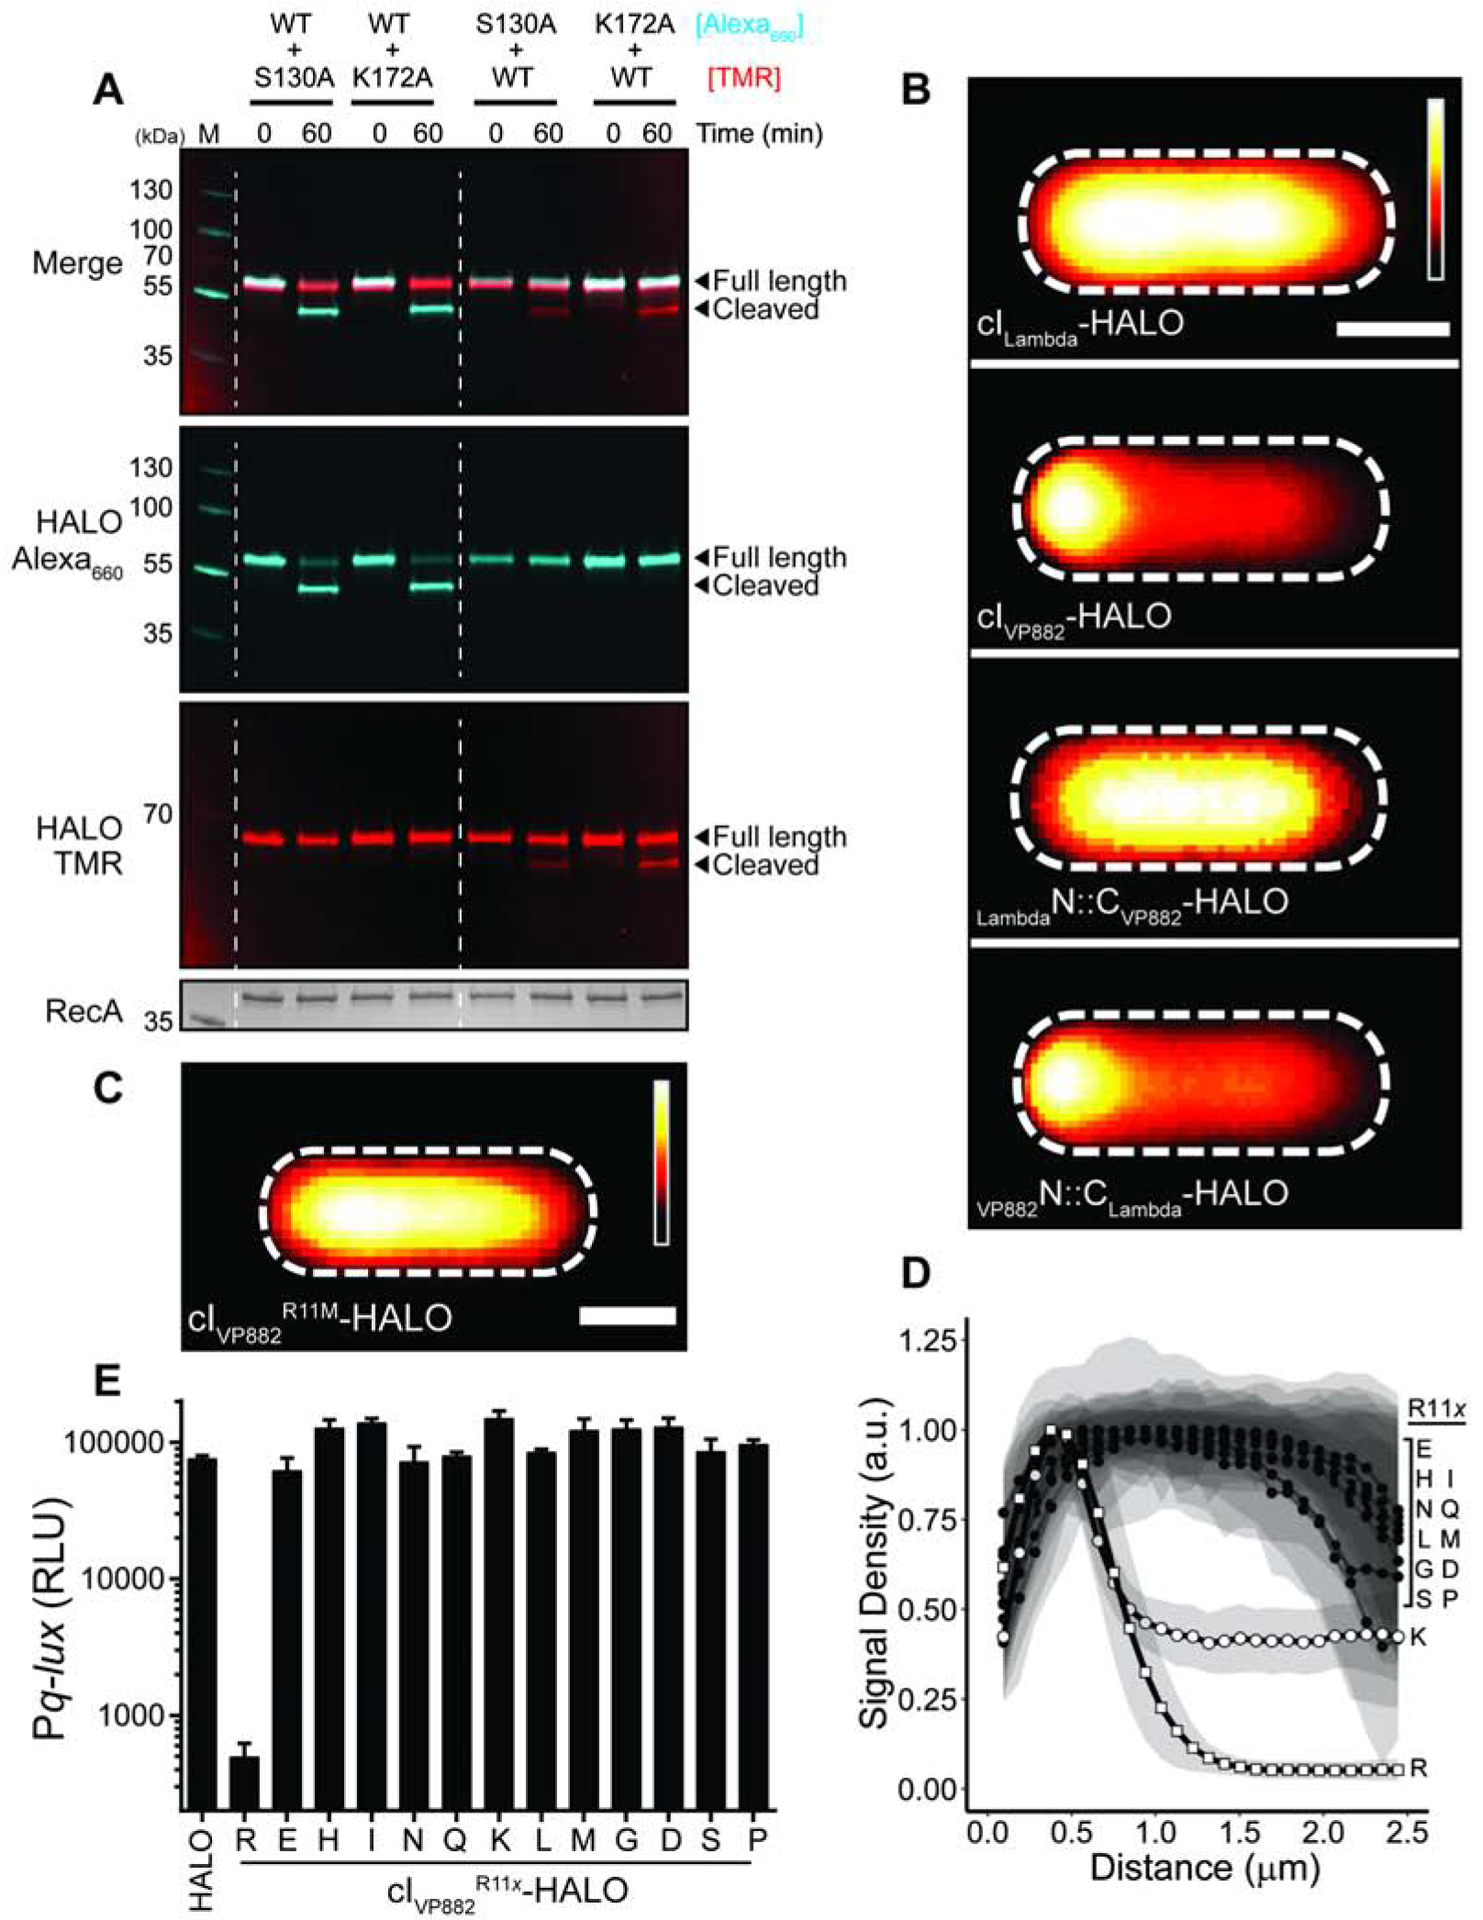
Figure 3. cIVP882 is cleaved by an intramolecular mechanism and Qtip recognition occurs at the N-terminus of cIVP882.

(A) In vitro cleavage of WT cIVP882-HALO mixed with cIVP882 catalytic-site variants monitored by SDS-PAGE analysis and differential labeling. The first lane has the marker, M. The HALO dye combinations used are designated to the right of the proteins. The lanes between the dashed white lines show WT cIVP882-HALO conjugated to HALO-Alexa660 (cyan) and catalytic-site variants conjugated to HALO-TMR (red). The lanes to the right of the second dashed white line show WT cIVP882-HALO conjugated to HALO-TMR (red) and the catalytic-site variants conjugated to HALO-Alexa660 (cyan). The gel was imaged under Cy5 and Cy3 filter sets to detect HALO-Alexa660 and HALO-TMR, respectively, as designated on the left (see also Figure S1B), prior to being stained for total protein (bottom panel). The composite of the HALO-Alexa660 and HALO-TMR channels is shown in the upper-most panel, designated Merge. (B) Composite images from individual cell analyses of E. coli producing Qtip and either cILambda, cIVP882, or the indicated chimeras, each fused to HALO and labeled with HALO-TMR. (C) As in (B) with Qtip and cIVP882R11M-HALO. In (B) and (C), HALO-TMR fluorescence intensity and scale bar represented as in Figure 1D. (D) Line plot of HALO-TMR fluorescence intensity extracted from individual cell images of E. coli producing Qtip and either WT cIVP882-HALO (designated R) or another cIVP882R11x-HALO variant (designated by the letters on the right). WT cIVP882-HALO (open squares) and cIVP882R11K-HALO (open circles) and the cIVP882R11x-HALO variants (closed circles). Distance along the x-axis as in Figure 1D. Shaded regions represent ± 1 SD from the mean. (E) Light production by E. coli harboring the Pq-lux reporter and a control plasmid (HALO), WT cIVP882-HALO (denoted R), or the designated cIVP882R11x-HALO variant. The x indicates the amino acid residue at position 11. RLU as in Figure 1. Data represented as mean ± SD with n = 3 biological replicates. See also Figures S1 and S2.
