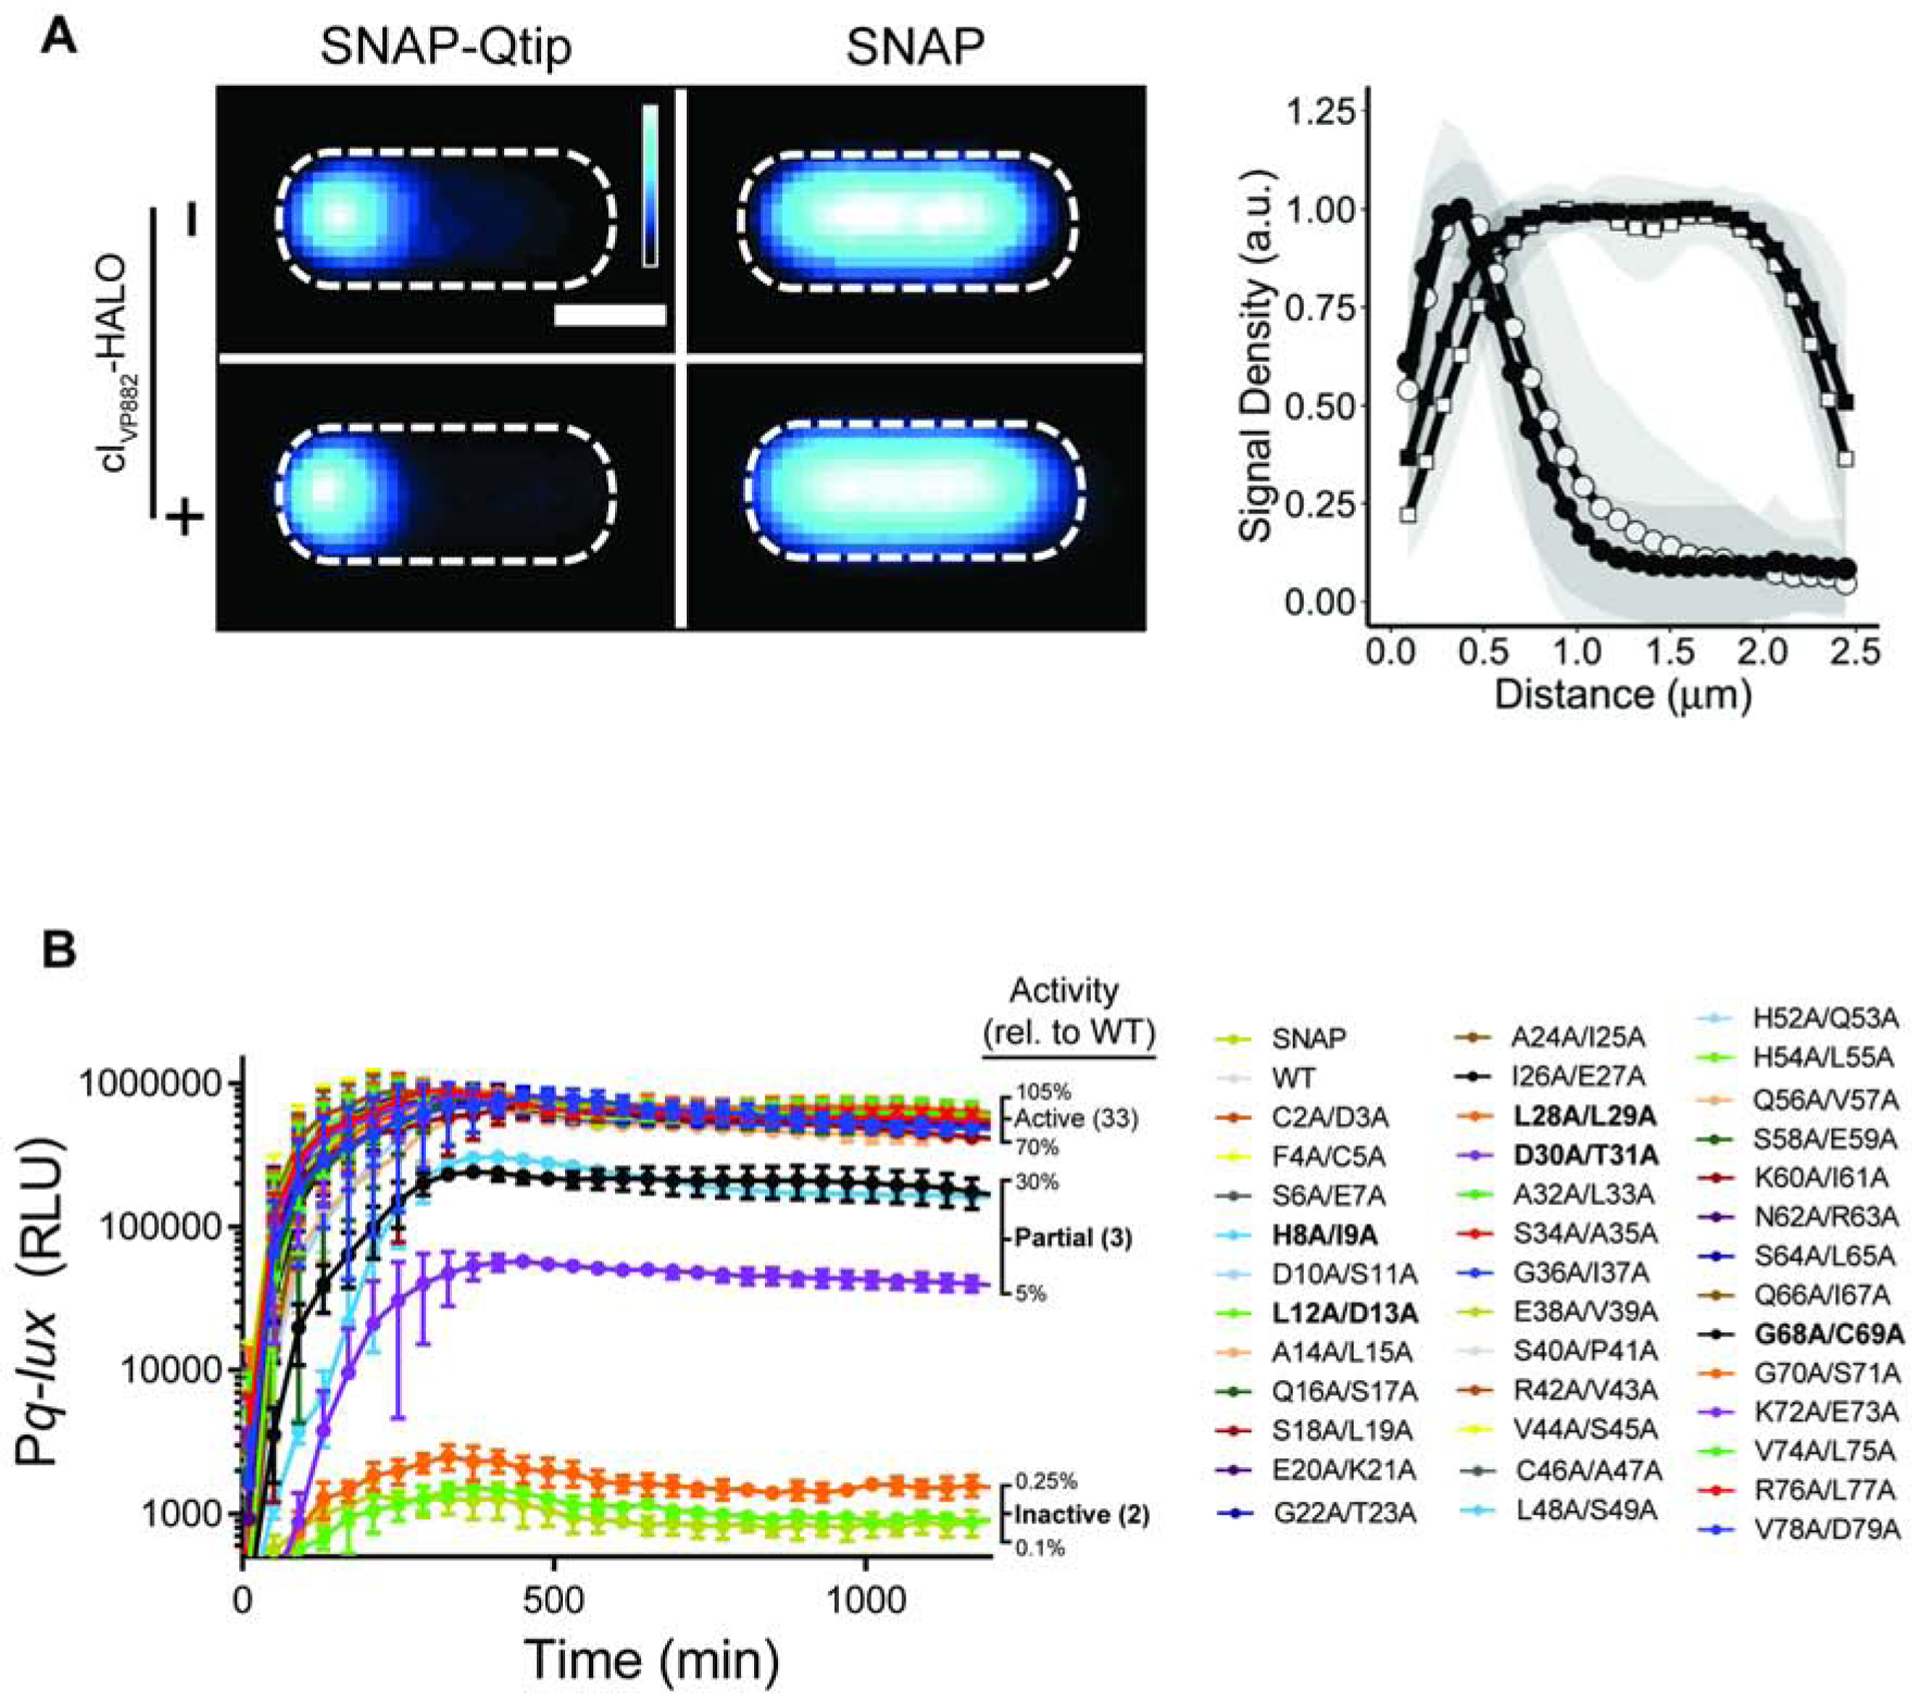
Figure 4. SNAP-Qtip localizes to the poles in the absence of its partner repressor cIVP882.

(A) Left: Composite images from individual cell analyses of E. coli producing SNAP-Qtip or SNAP, in the absence or presence of cIVP882-HALO (designated as − or + on the left side of the images) labeled with SNAP-JF503. SNAP-JF503 fluorescence intensity is displayed as a cyan heat map. Black and white reflect the lowest and highest intensity, respectively. Scale bar, as in Figure 1D. Right: Line plot of SNAP-JF503 fluorescence intensity extracted from individual cell images used in the left panel. Distance along the x-axis as in Figure 1D. Symbols: SNAP-Qtip (circles) and SNAP (squares), each in the absence (open) or presence (closed) of cIVP882-HALO. Shaded regions represent ± 1 SD from the mean. (B) Time-course of light production from the Pq-lux reporter in E. coli producing cIVP882 and either SNAP, WT SNAP-Qtip, or the designated SNAP-Qtip double-alanine variant. Variants exhibiting partial activity or that are inactive are shown in bold text in the key. RLU as in Figure 1. Data represented as mean ± SD with n = 3 biological replicates. See also Figures S3, S4, and S5.
