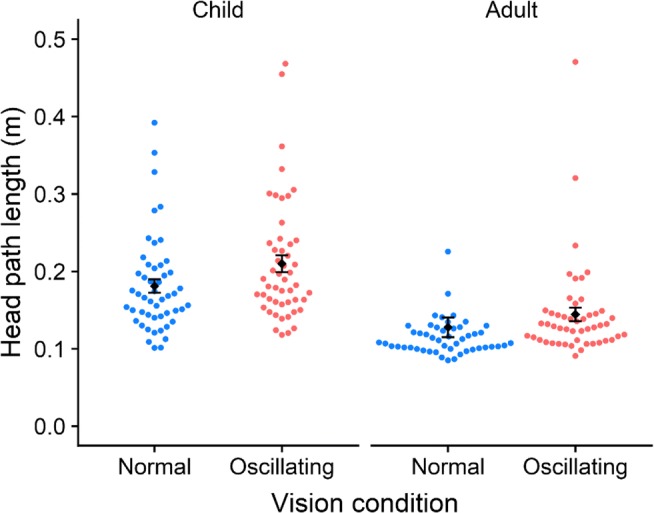
Fig. 7.

Head path length (where higher values indicate worse postural stability) as a function of vision condition. The two conditions were “normal” (static virtual room) and “oscillating” (oscillating virtual room). Postural stability was indexed by the path length of head movement, in meters (measured over a 10-s period). Adults showed a significantly different path length overall, as compared to children (shorter, indicating greater stability). Error bars represent ± 1 SEM.
