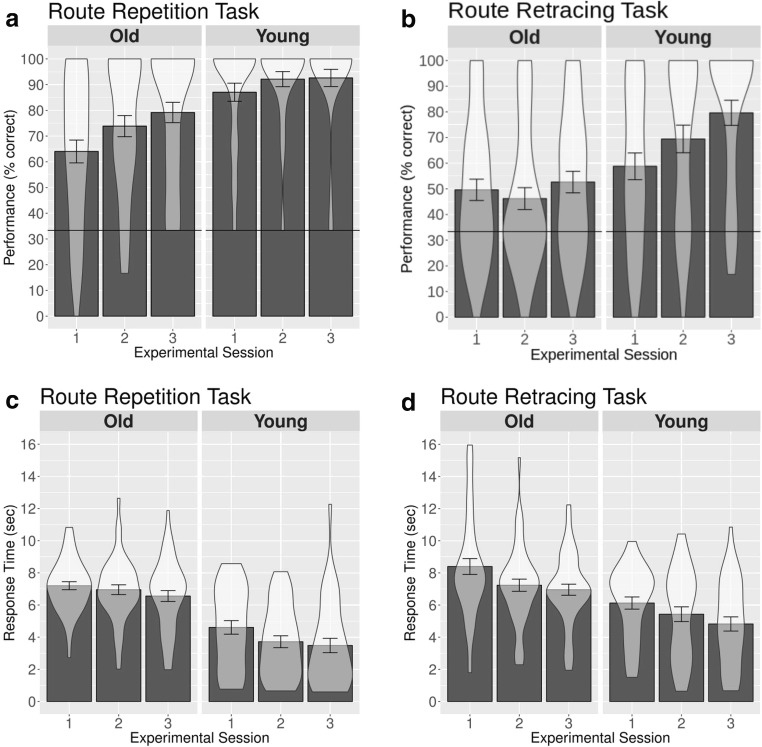
Fig. 4.
Performance (a, b) and response times (c, d) for the older and younger participants in the route-repetition and the route-retracing tasks as a function of experimental sessions. The horizontal lines in panels a and b represent chance-level performance. The bars represent mean values, the error bars represent standard errors of the means, and we have overlaid the probability density of the participants’ performance or response times at different values. The plots were generated using the ggplot 2 package in R (Wickham, 2016)

