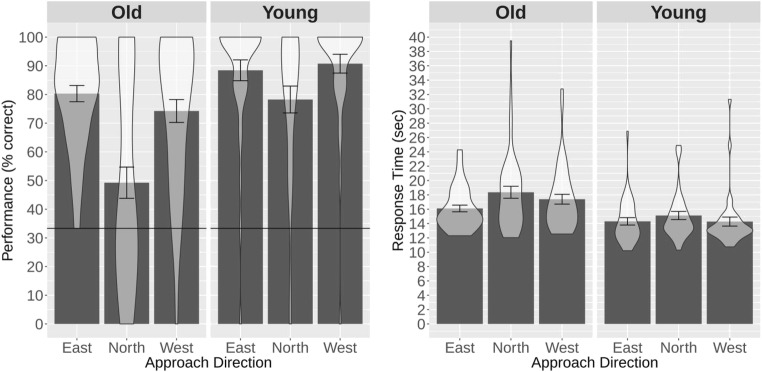
Fig. 5.
Performance (left) and response times (right) for the older and younger participant groups in the directional-approach task. The horizontal line in the left plot represents chance level. Note that approaching the intersection from the east or west was misaligned with the encoding view by 90°, whereas approaching the intersection from the north was misaligned with the encoding view by 180°. Bars represent mean values, error bars represent standard errors of the means, and we have overlaid the probability density of participants’ performance or response times at different values. The plots were generated using the ggplot 2 package in R (Wickham, 2016)

