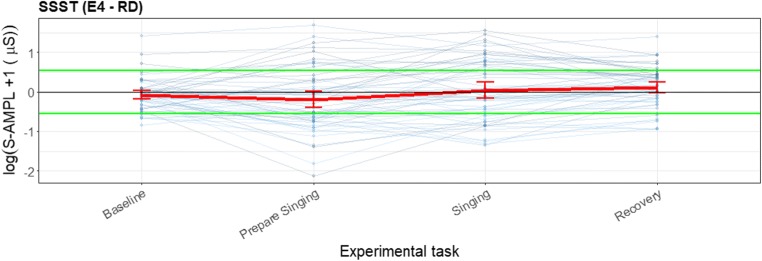
Fig. 10.
Error bar plot for the differences for each participant during the sing-a-song-stress task (SSST) and for the mean and standard error during each task (red line) for all participants, with total amplitude of SCRs as the parameter of interest (blue lines). The black line is the zero axis, and the green lines are the a priori defined boundaries (size of the reference effect). For the SSST, the first experimental task was a neutral baseline, the second was preparing to sing, the third was singing, and the last was the baseline directly after singing

