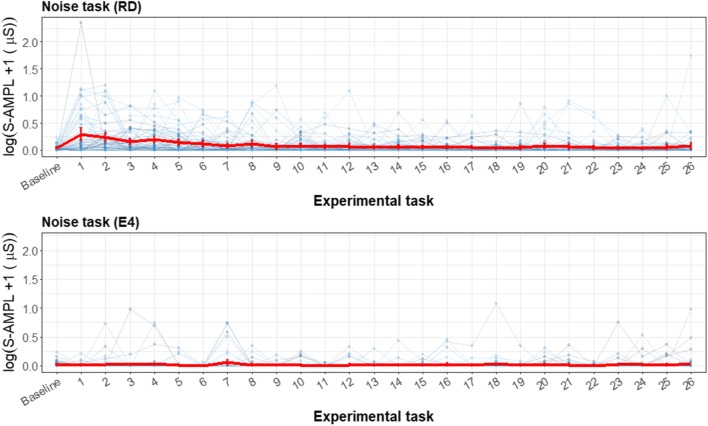
Fig. 11.
Error bar plots for each participant (thin blue lines) during the noise task, retrieved with the reference device (RD) and the E4 wearable. The mean and SE during each task for all participants, with the total amplitude of SCRs as the parameter of interest, are indicated with red lines. The y-scale is given as a logarithm, to show the difference in the lower regions and not have too much emphasis placed on the higher values. For the noise task, the same baseline is given as for the SSST, and every number represents a beep

