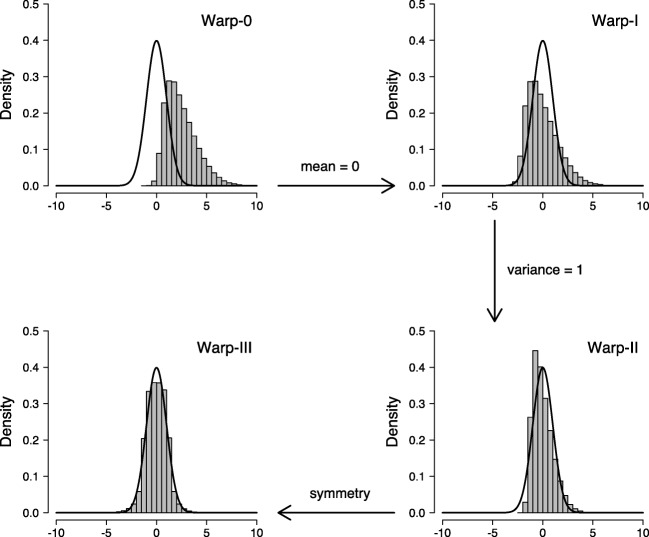
Fig. 1.
Illustration of the warping procedure. The solid black line shows the standard normal proposal distribution and the gray histogram shows the posterior samples. Available at https://tinyurl.com/y7owvsz3 under CC license https://creativecommons.org/licenses/by/2.0/

