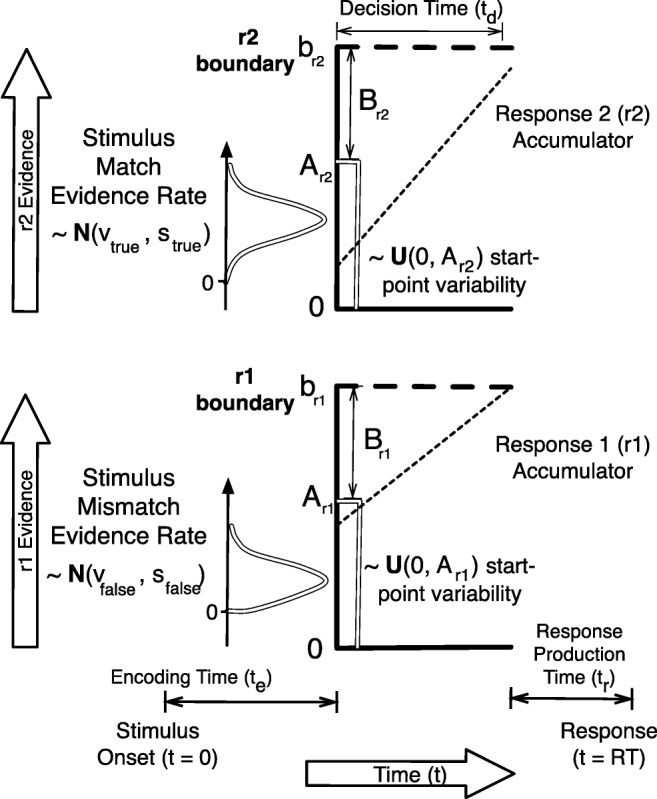
Fig. 2.

Graphical representation of the linear ballistic accumulator for two possible responses (r1 and r2) corresponding to two stimuli (s1 and s2). The figure illustrates a case where s2 is presented and the sampled rate for the r2 accumulator is greater than the sampled rate for the r1 accumulator, i.e., the accumulation path (dashed line) is steeper for r2 than for r1. However, as the sampled starting point for r1 is higher than for r2, the r1 accumulator has a sufficient head start to get to its threshold first after time td. The resulting response is an error, with RT = t0 + td. Available at https://tinyurl.com/yc4n8lpm under CC license https://creativecommons.org/licenses/by/2.0/
