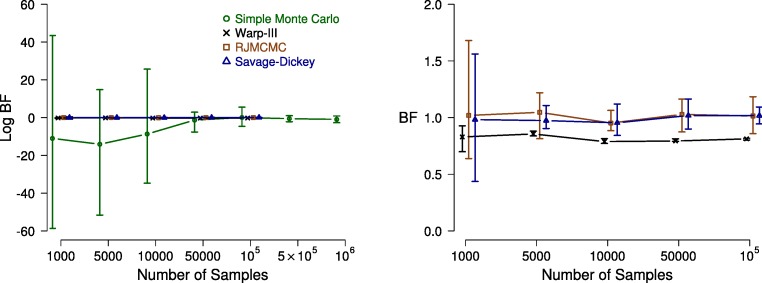
Fig. 3.
Bayes factor estimates for the single-participant case as a function of the number of samples. The left panel displays the log Bayes factor estimates computed using the Warp-III (black crosses), simple Monte Carlo (green circles), Savage–Dickey (blue triangles), and RJMCMC (brown squares) methods. The right panel displays the Bayes factor estimates computed using the Warp-III (black crosses), Savage–Dickey (blue triangles), and RJMCMC (brown squares) methods (i.e., omitting the simple Monte Carlo estimates and displaying the results on the Bayes factor and not log Bayes factor scale). For Warp-III, the x-axis corresponds to the number of posterior samples (collapsed across all chains) used for computing the marginal likelihood for each model. For simple Monte Carlo, it corresponds to the number of prior samples used for computing the marginal likelihoods. For Savage–Dickey, it corresponds to the number of posterior samples used to estimate the density of the posterior distribution at the test value (i.e., 3.55). For RJMCMC, it corresponds to the number of posterior samples used from each model (for details, see the Appendix). The symbols (i.e., crosses, circles, triangles, squares) indicate the median (log) Bayes factor estimates and bars indicate the range of the estimates across the ten repetitions. Available at https://tinyurl.com/y5brs44a under CC license https://creativecommons.org/licenses/by/2.0/

