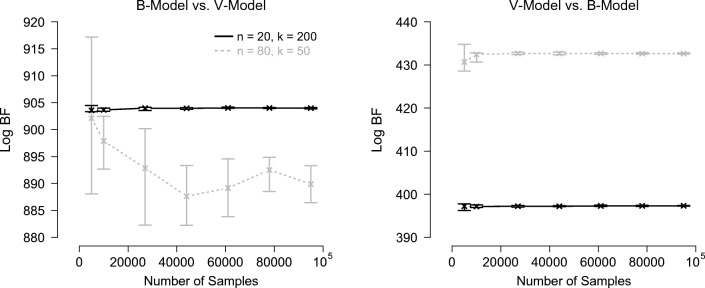
Fig. 5.
Log Bayes factor estimates obtained with Warp-III sampling for the non-nested hierarchical model comparisons as a function of the number of posterior samples (collapsed across all chains) used for computing the marginal likelihood for each model. Crosses indicate the median log Bayes factor estimates and bars indicate the range of the estimates across the ten repetitions. The left panel shows results for the data sets generated from the B-model; the right panel shows results for the data sets generated from the V -model. Results for n = 20 with k = 200 are displayed in black; results for n = 80 with k = 50 are displayed in gray with dotted lines. The log Bayes factor is expressed in favor of the data-generating model. Available at https://tinyurl.com/y3f7l263https://tinyurl.com/y3f7l263 under CC license https://creativecommons.org/licenses/by/2.0/

