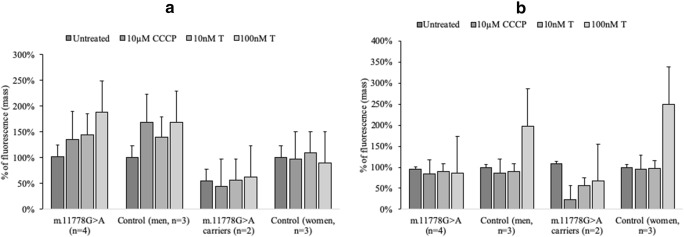
Fig. 3.
Effect of testosterone on mitochondrial mass in m.11778G > A and control lymphoblasts. Cells were incubated with 10 nM and 100 nM concentrations of testosterone (T), autophagy was induced by 10 μM CCCP. Fluorescence was measured at 485-535 nm. a. Cells grown in complete medium for 4 h. b. Cells grown in complete medium for 24 h. Fluorescence was normalized to untreated control sample according to cell line sex (affected m.11778G > A (XY)/Control (XY), m.11778G > A carriers (XX)/Control (XX)). Data represented as a mean value ± SD where each experiment was repeated 3 times. For data compared within men/women groups multifactorial ANOVA was used

