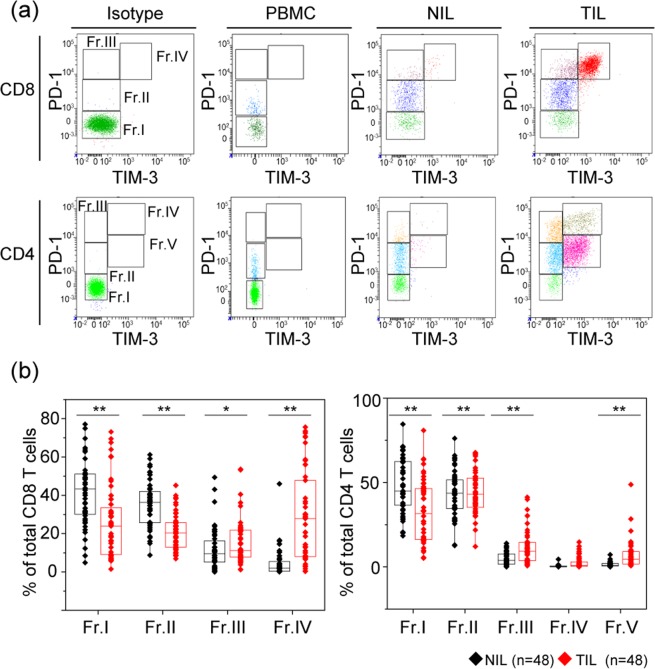
Figure 1.
Co-expression pattern of PD-1 and TIM-3 on both CD8 and CD4 T cells of peripheral blood mononuclear cells (PBMC), adjacent normal tissue-infiltrating lymphocytes (NILs), and tumour tissue-infiltrating lymphocytes (TILs) in 48 patients with renal cell carcinoma. (a) Gating strategy to identify subsets of CD8 and CD4 T cells within PBMC, NILs, and TILs. CD8 T cells were classified into four groups (Fr. I: PD-1-TIM-3−, Fr. II: PD-1lowTIM-3−, Fr. III: PD-1+TIM-3−, Fr. IV: PD-1+TIM-3+), and CD4 T cells were classified into 5 groups (Fr. I: PD-1-TIM-3−, Fr. II: PD-1lowTIM-3−, Fr. III: PD-1+TIM-3−, Fr. IV: PD-1+TIM-3+, Fr. V: PD-1lowTIM-3+). (b) Expression ratios of each fraction on both CD4 and CD8 T cells were compared among NILs and TILs simultaneously extracted from the same patients. Comparison of two sample types was performed by Mann-Whitney U test. The central tendency of the box plot shows the median of each group, and the upper and lower ranges of the box plot show the 25th and 75th percentiles of each data set, respectively. **P < 0.01, *P < 0.05.

