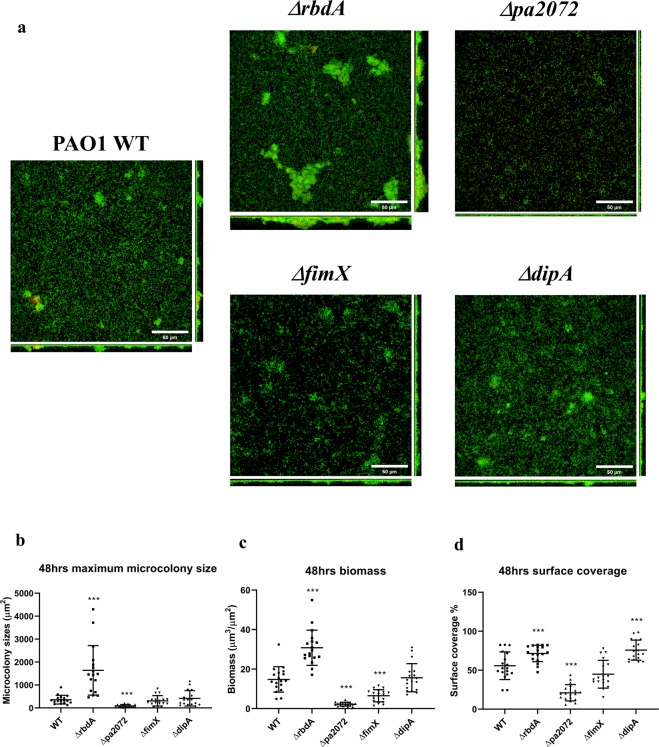
Figure 3.
Biofilm morphologies of the four mutants of interest. Biofilms formed after 48 hrs for ΔrbdA, Δpa2072, ΔfimX, and ΔdipA, compared with PAO1 WT. (A) Confocal laser scanning micrographs at 63× magnification (scale bar 50 μm); live cells are stained with SYTO-9 (green); dead cells are stained with propidium iodide (red). (B) Quantification of microcolony size. (C) Quantification of biofilm biomass. (D) Quantification of surface coverage. For data shown in B-D, the Welch’s T-test was used to determine significances, where ***denotes a confidence level of p < 0.01. Data acquired from 3 independent experiments.

