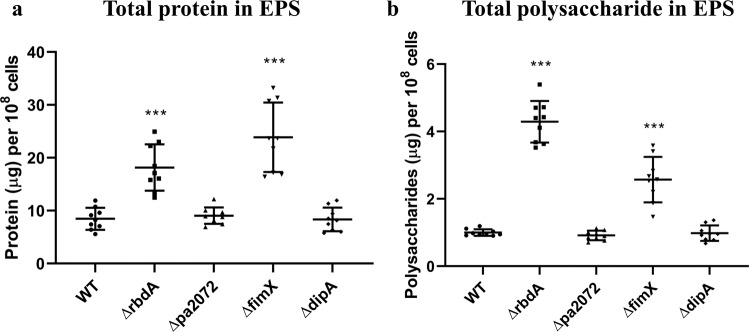
Figure 5.
Constituent components of the EPS within the different examined mutants. Quantification of EPS from 108 cells of 48 hrs biofilms of ΔrbdA, ΔfimX, ΔdipA and Δpa2072, compared with PAO1 WT. Total protein (A) and polysaccharide (B) mass are shown in comparison to PAO1 WT, where the Welch’s T-test was used to determine the significances, and ***denotes a confidence level of p < 0.01. Data acquired from 3 independent experiments.

