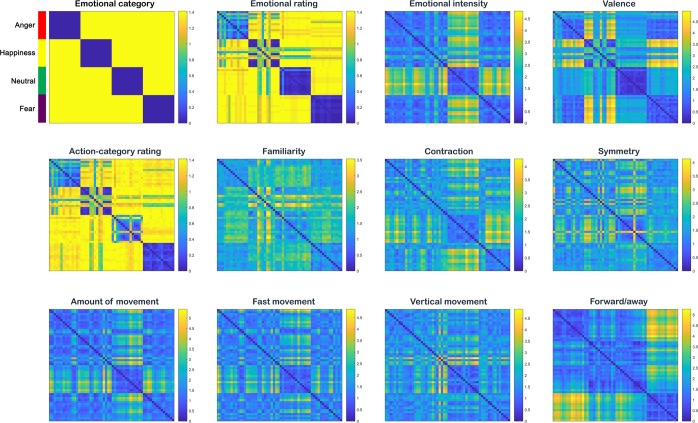
Figure 5.
Representational dissimilarity matrices of the behavioural ratings. The RDMs represent pairwise comparisons between the 56 stimuli with regard to the each of the behavioural ratings (see Supplementary Materials for more information). The dissimilarity measure reflects Euclidean distance, with blue indicating strong similarity and yellow strong dissimilarity. Colour lines in the upper left corner indicate the organization of the RDMs with respect to the emotional category (anger: red; happiness: yellow; neutral: green; fear: purple) of the video stimuli.

