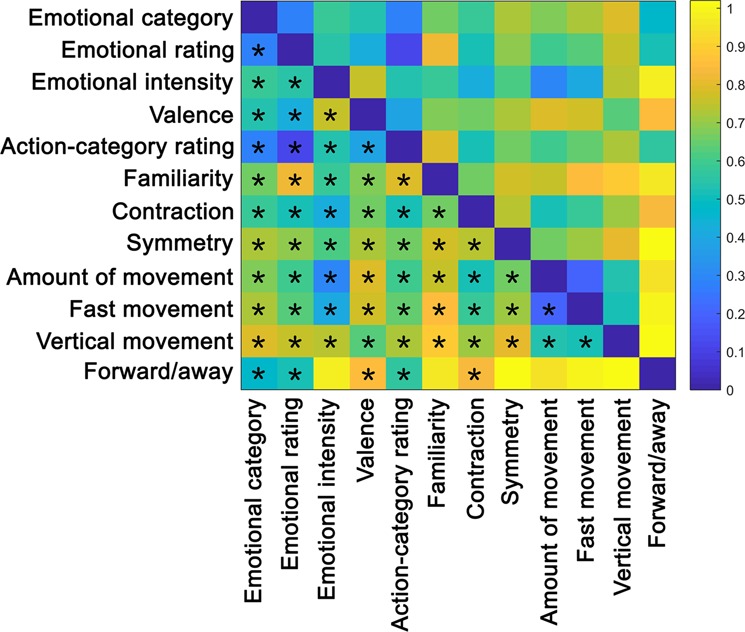
Figure 6.

Correlation between representational dissimilarity matrices of the different behavioural ratings. The RDM represents the level of (dis)similarity between each of the behavioural-rating matrices (see Fig. 5). Distances are indicated in 1-Spearman’s correlation values, with blue indicating strong similarity and yellow strong dissimilarity. Asterisks below the diagonal indicate significant correlations after Bonferroni correction (αbonf = 0.05/12, with 12 comparisons per behavioural rating; see Table SR3 in Supplementary Results for correlation and p-values).
